01. Overview
Controlling SAP data replication - end to end
During an SAP transformation, data doesn't move in one large batch - it moves continuously, in structured streams, between source and target systems, across multiple platforms and environments simultaneously. Managing this process requires visibility at every level: which pipelines are running, which objects are syncing, which have failed, and what the status of each individual data record is.
Glue Cloud is the CrystalBridge module built to own this layer. It is the operational hub where transformation teams create and configure data replication pipelines, monitor their progress in real time, manage field mappings, set schedules, and respond to errors - all from a single interface, without switching between external tools or dashboards.
Unlike the Organization Structure module, which existed in some form in CrystalBridge 1.0, Glue Cloud was built entirely from zero - a new product within an established platform, with no prior version to reference and no legacy patterns to inherit.
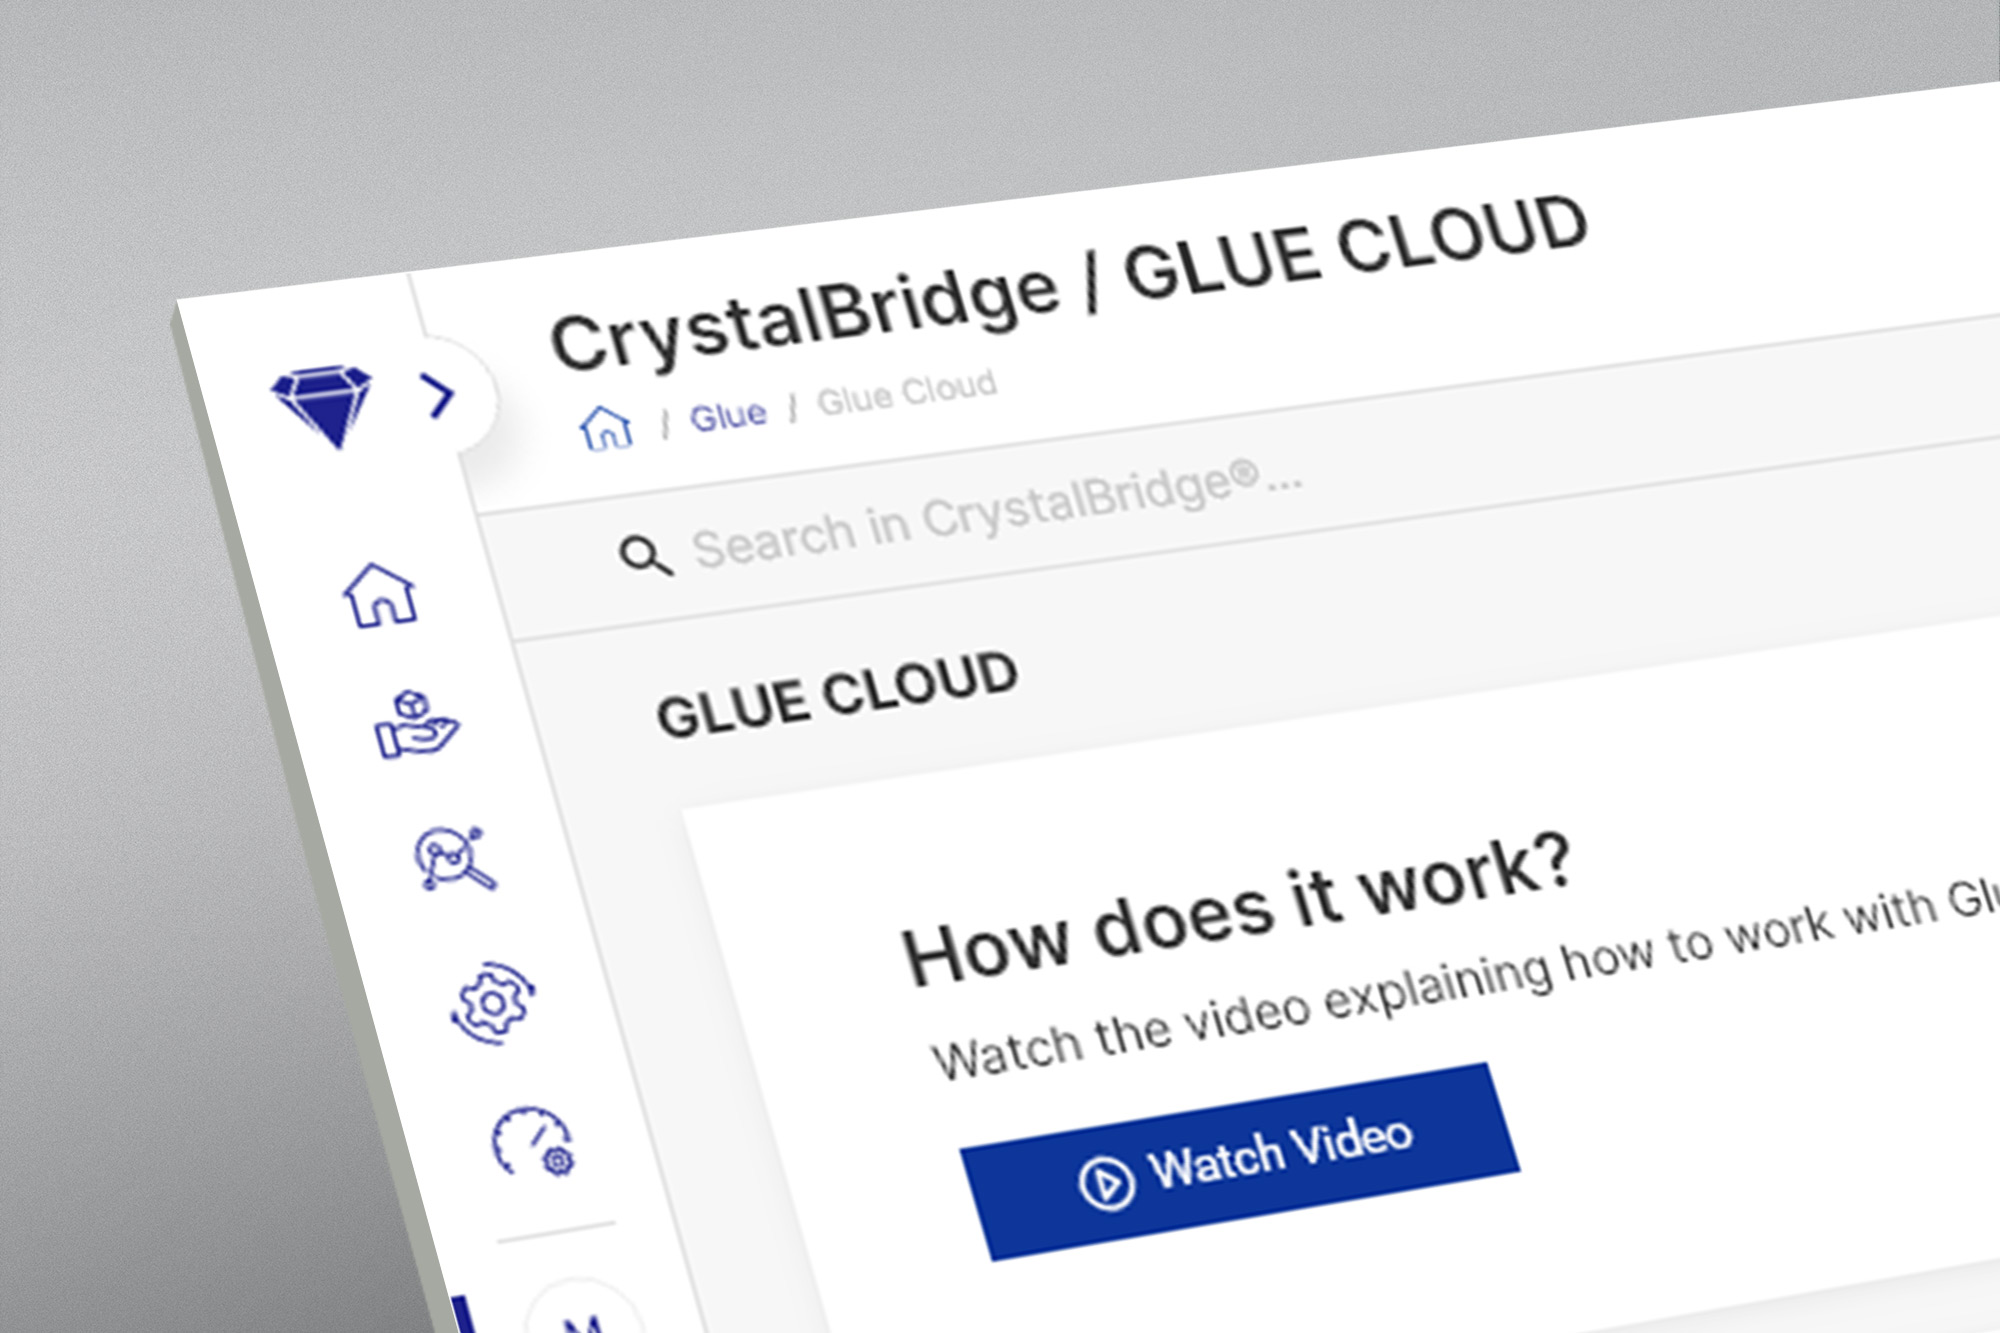
02. The challenge
Complex tool with no design reference
Starting from zero is both an opportunity and a constraint. There were no existing patterns to audit, no user complaints about a predecessor to address - but also no established mental models to build on, and no interface heritage to draw from. Every decision, from how pipelines would be represented, to how monitoring data would be structured, had to be made from first principles.
The users of Glue Cloud are not typical application users. They are primarily transformation consultants and technically proficient clients - people who understand SAP system architecture, care about data volume and sync timing, and need to diagnose problems quickly in high-stakes project environments. The tool had to match their level of technical literacy without becoming opaque to less experienced stakeholders also using it.
Core design challenge
"How do you design a control interface for a process that spans multiple enterprise systems, involves thousands of data objects, and runs continuously - so that it feels manageable, not overwhelming?"
Three specific design problems needed solving. First, the pipeline lifecycle is long and multi-stage - creating a pipeline involves configuring a source, a destination, selecting and mapping objects, defining field mappings, setting sync schedules, and managing gateways. This had to be broken into a clear, step-by-step flow without losing context or making the user repeat steps unnecessarily.
Second, monitoring needed to scale to large datasets. A single pipeline can contain thousands of objects, each with its own sync progress, status, and history. The monitoring views had to present this data meaningfully without collapsing into tables of undifferentiated rows.
Third, the tool needed to work for both a technical expert and a less experienced client - the same interface had to be clear enough for a project stakeholder checking status, and precise enough for a consultant diagnosing a sync error.
03. My role
Sole designer, full lifecycle
Glue Cloud was my sole responsibility within the CrystalBridge 2.0 design team. The same workflow applied as with the Organization Structure module: JIRA-driven sprint planning, pre-work refinement with stakeholders, wireframes for logic validation, hi-fi built from the shared design system, and handoff to a dedicated group of developers.
The nature of Glue Cloud - a greenfield product rather than a redesign - meant that a larger proportion of the work happened in the early discovery and wireframing stages. Defining what the tool even contained, before designing how it looked, required more upfront conversation with stakeholders and more iteration on information architecture than a typical feature-level task.
04. The solution
From pipeline creation to live monitoring
Glue Cloud is organised around a clear information hierarchy: the module starts with a dashboard that gives an immediate operational overview - upcoming scheduled syncs, recent execution history, and quick-access actions. From there, the user navigates into Pipelines, Gateways, or individual pipeline detail views, each with its own set of tabs and tools.
The central concept is the pipeline - a configured replication job between a source system and a destination, containing a defined set of objects, a field mapping layer, a filter configuration, and a sync schedule. Every other screen in Glue Cloud either helps create a pipeline, monitors one in progress, or reviews its history.
The four-step wizard for creating a pipeline was the most structurally complex design problem: it had to guide a user through connection setup, settings, object selection with dual-pane browsing, field mapping across potentially thousands of source fields, and schedule definition - without ever feeling like a form dump. Each step was designed to be independently useful and self-contained, with progress preserved across steps.
Dashboard with operational overview
At-a-glance view of upcoming scheduled syncs, execution history, and quick-start actions. Designed to be the entry point for both daily monitoring and new pipeline creation.
4-step pipeline creation wizard
Guided flow: create pipeline → define settings → object setup (selection + field mapping) → define schedule. Progress is persistent and each step is independently editable.
Real-time monitoring with drill-down
Monitor tab shows per-object progress bars, overall completion donut, ETA, transferred row count, and a live bar chart of object volumes - all updating in real time.
Field mapping & filter layer
Per-object field mapping from source to destination, with formula support. Separate filter configuration to scope the data subject to synchronisation at object level.
Gateway management
Gateways Overview with Docker and manual deployment options, one-time token generation, and host configuration - abstracting the technical connection layer for less technical users.
Contextual object detail panel
Clicking any object opens a right-side panel with full source/target container details, sync status, schedule info, and stop/delete controls - without navigating away from the list.
05. Key screens
A walkthrough of the core interface
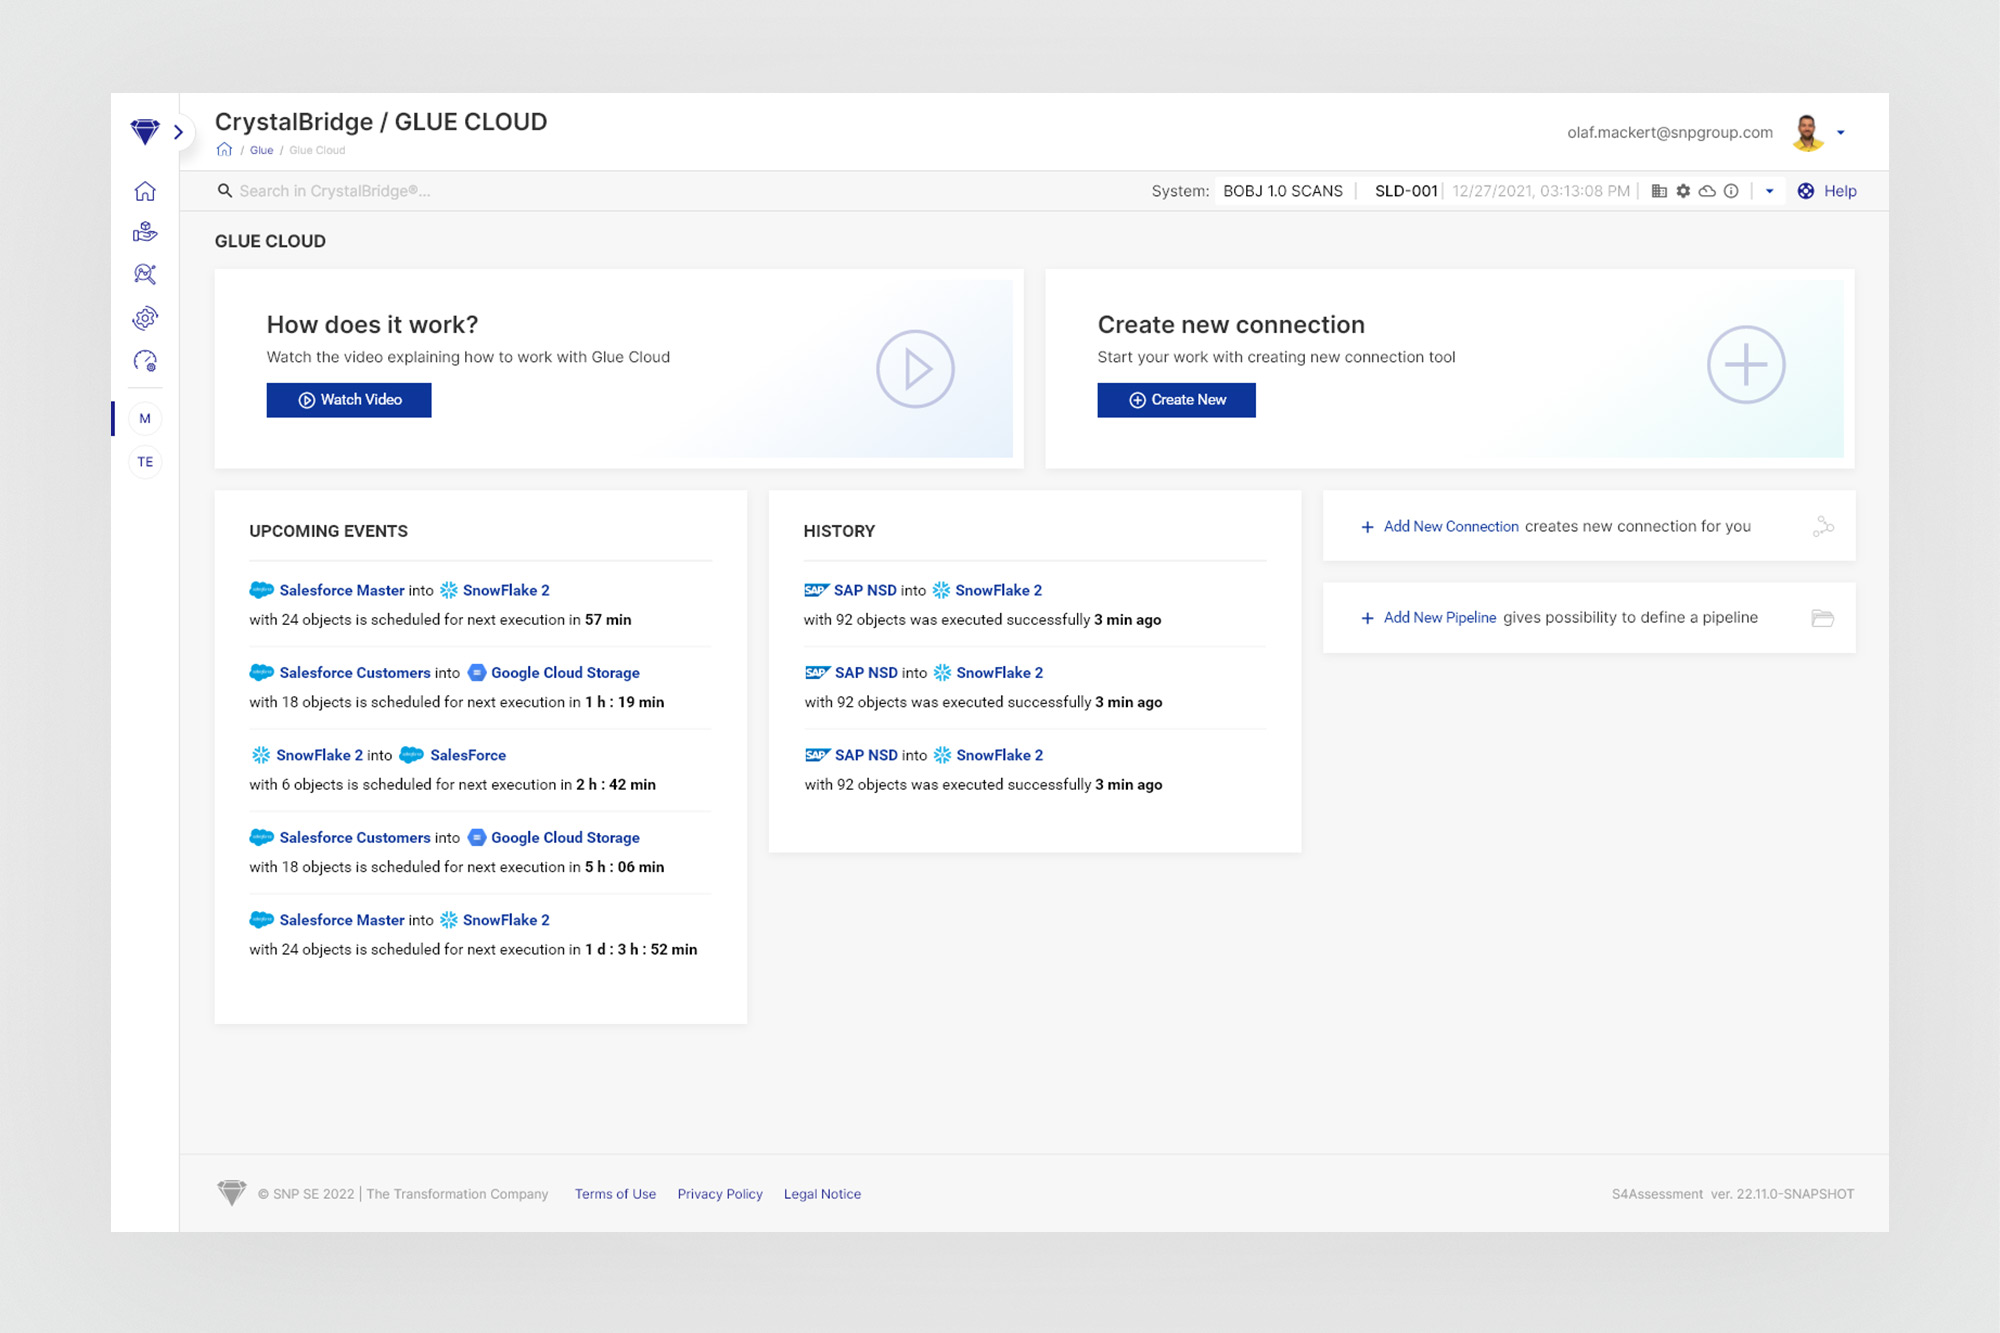
Dashboard - the entry point. Three panels: upcoming scheduled syncs with countdown timers, recent execution history, and quick-start actions. Designed to give an operational read at a glance without requiring navigation into individual pipelines.
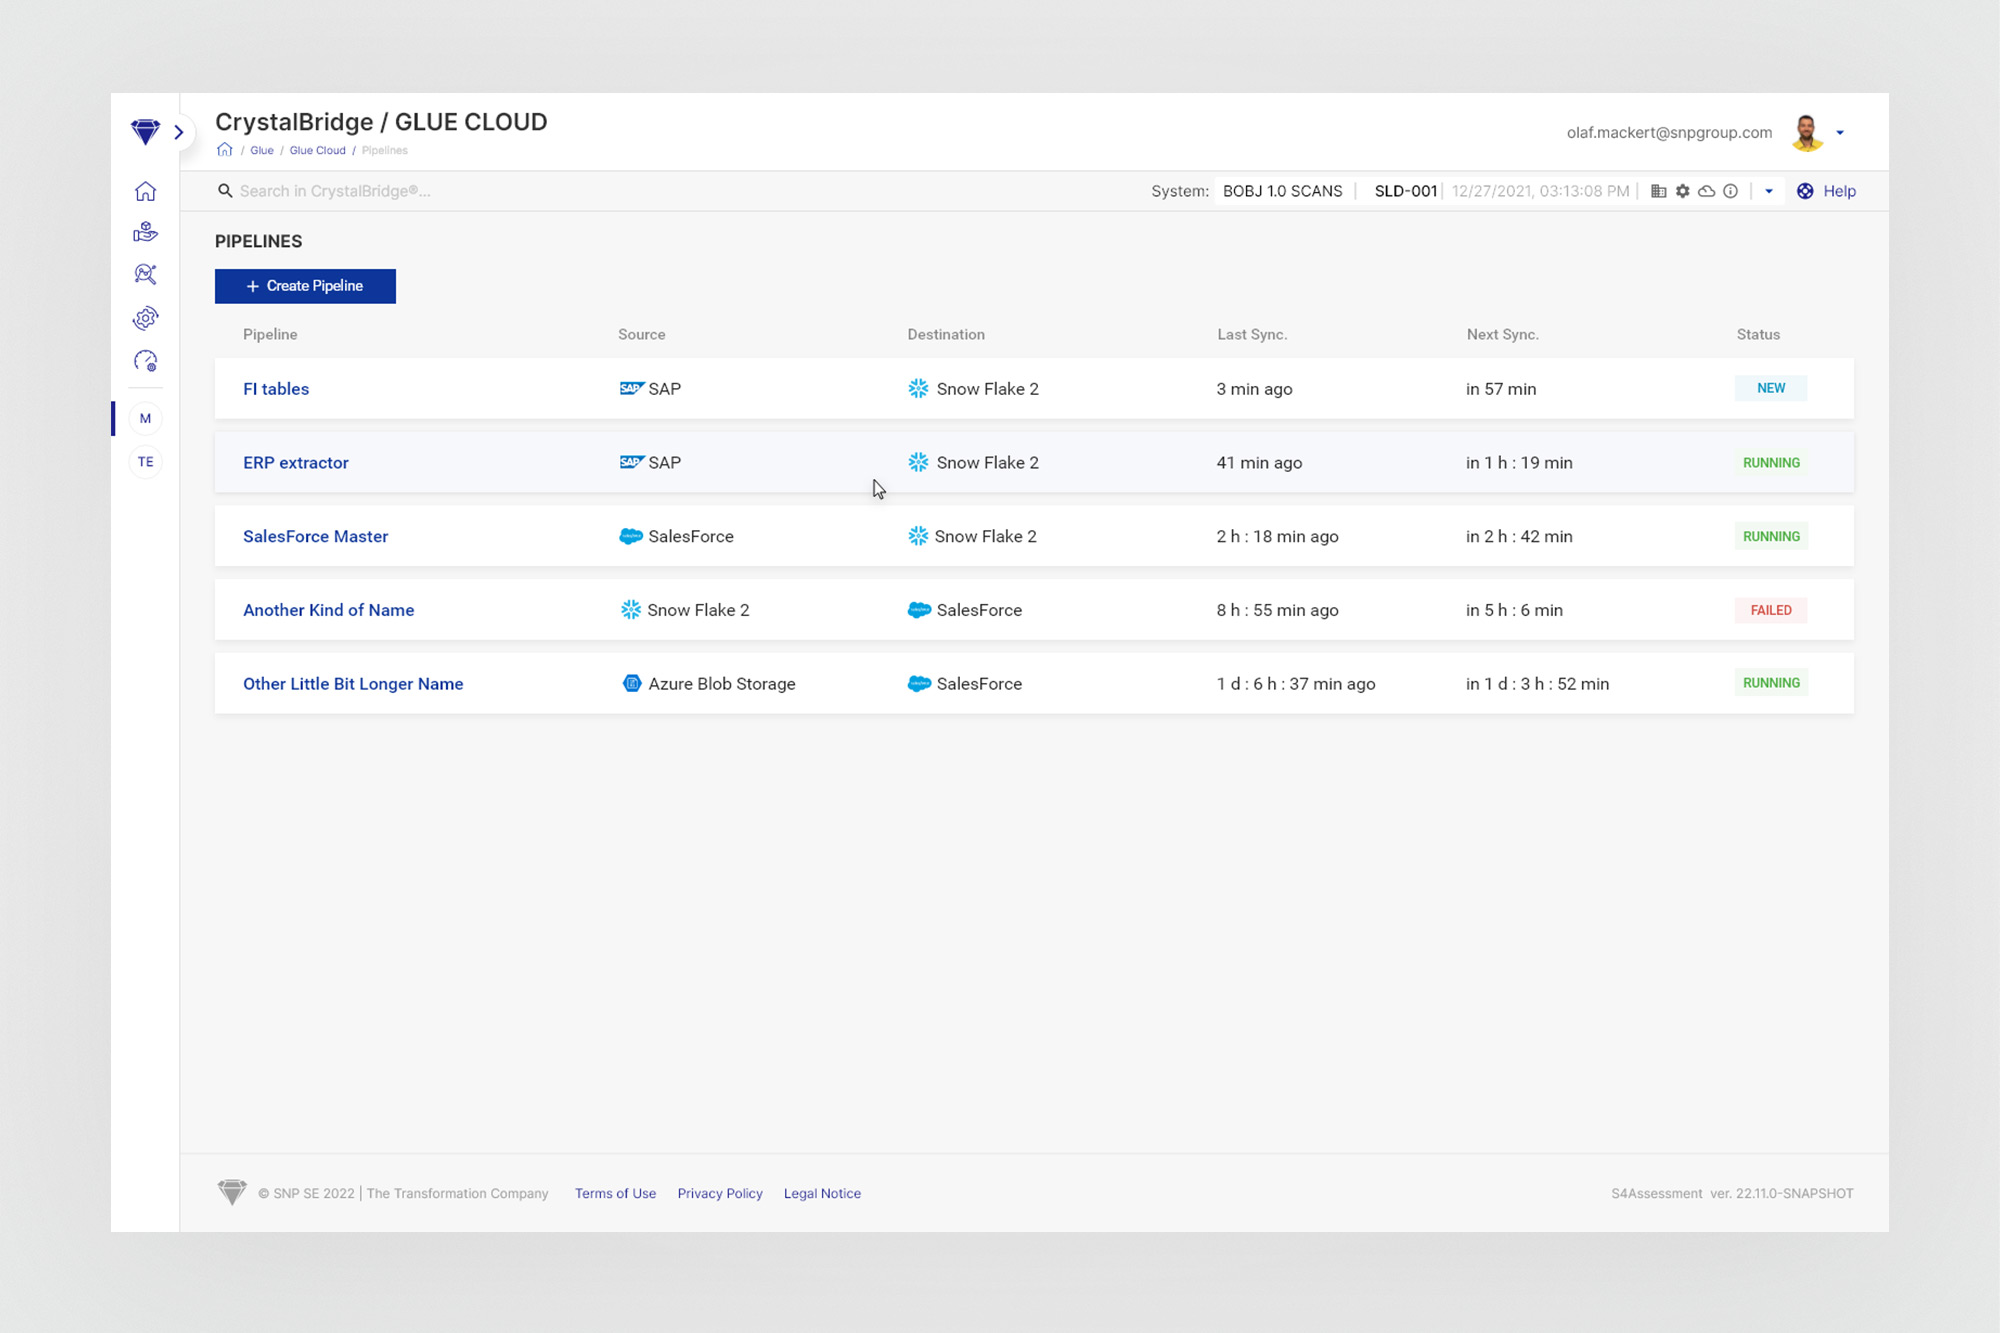
Pipelines list - all configured pipelines in a single table: source system, destination, last sync timing, next sync timing, and status (NEW / RUNNING / FAILED). Status is the primary signal; the colour-coded badge draws attention to failures immediately.
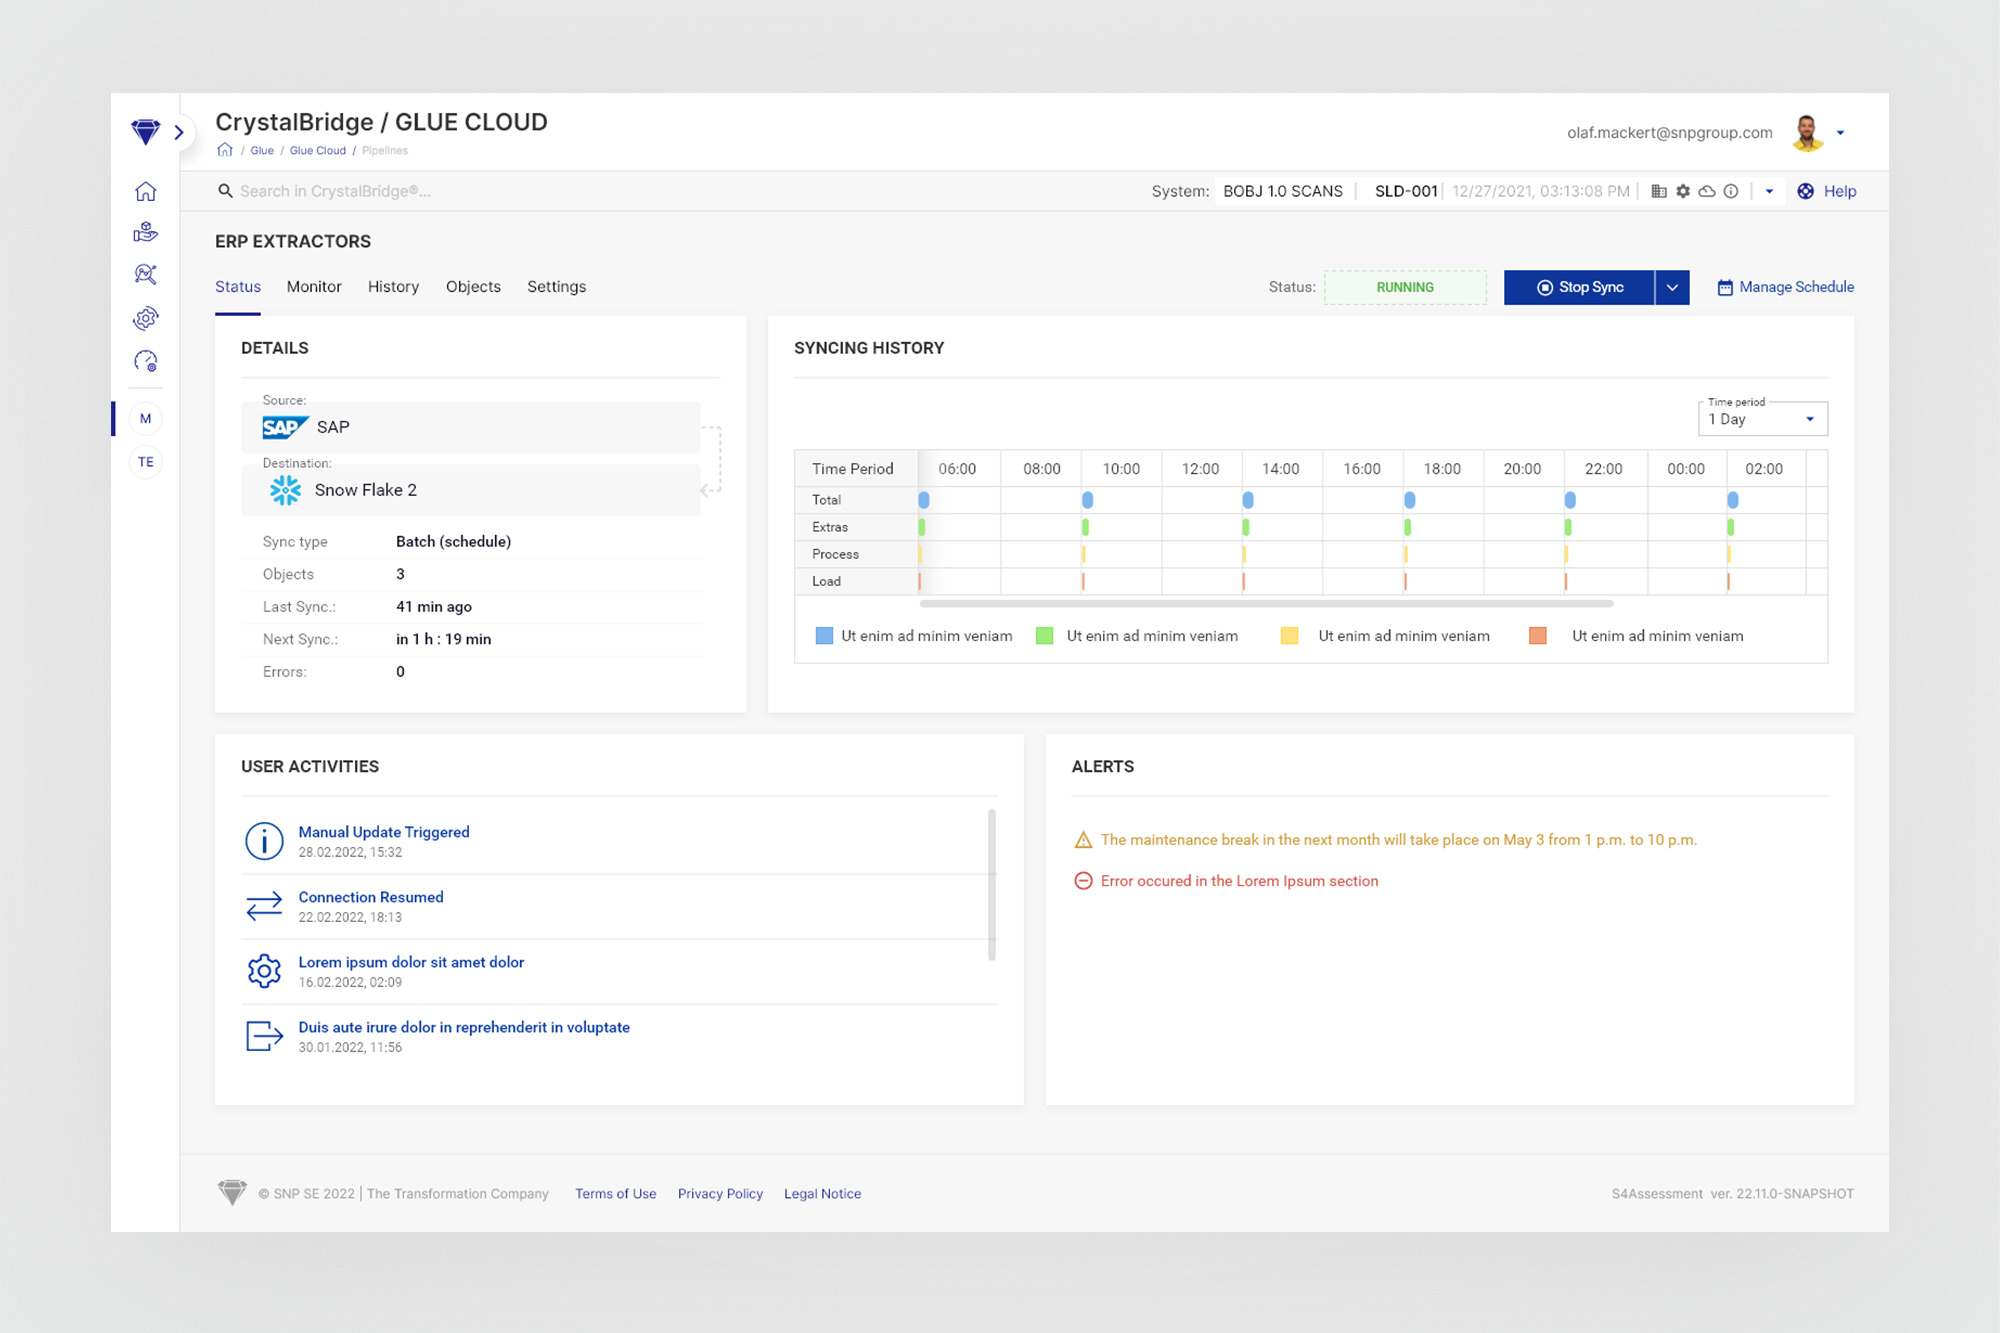
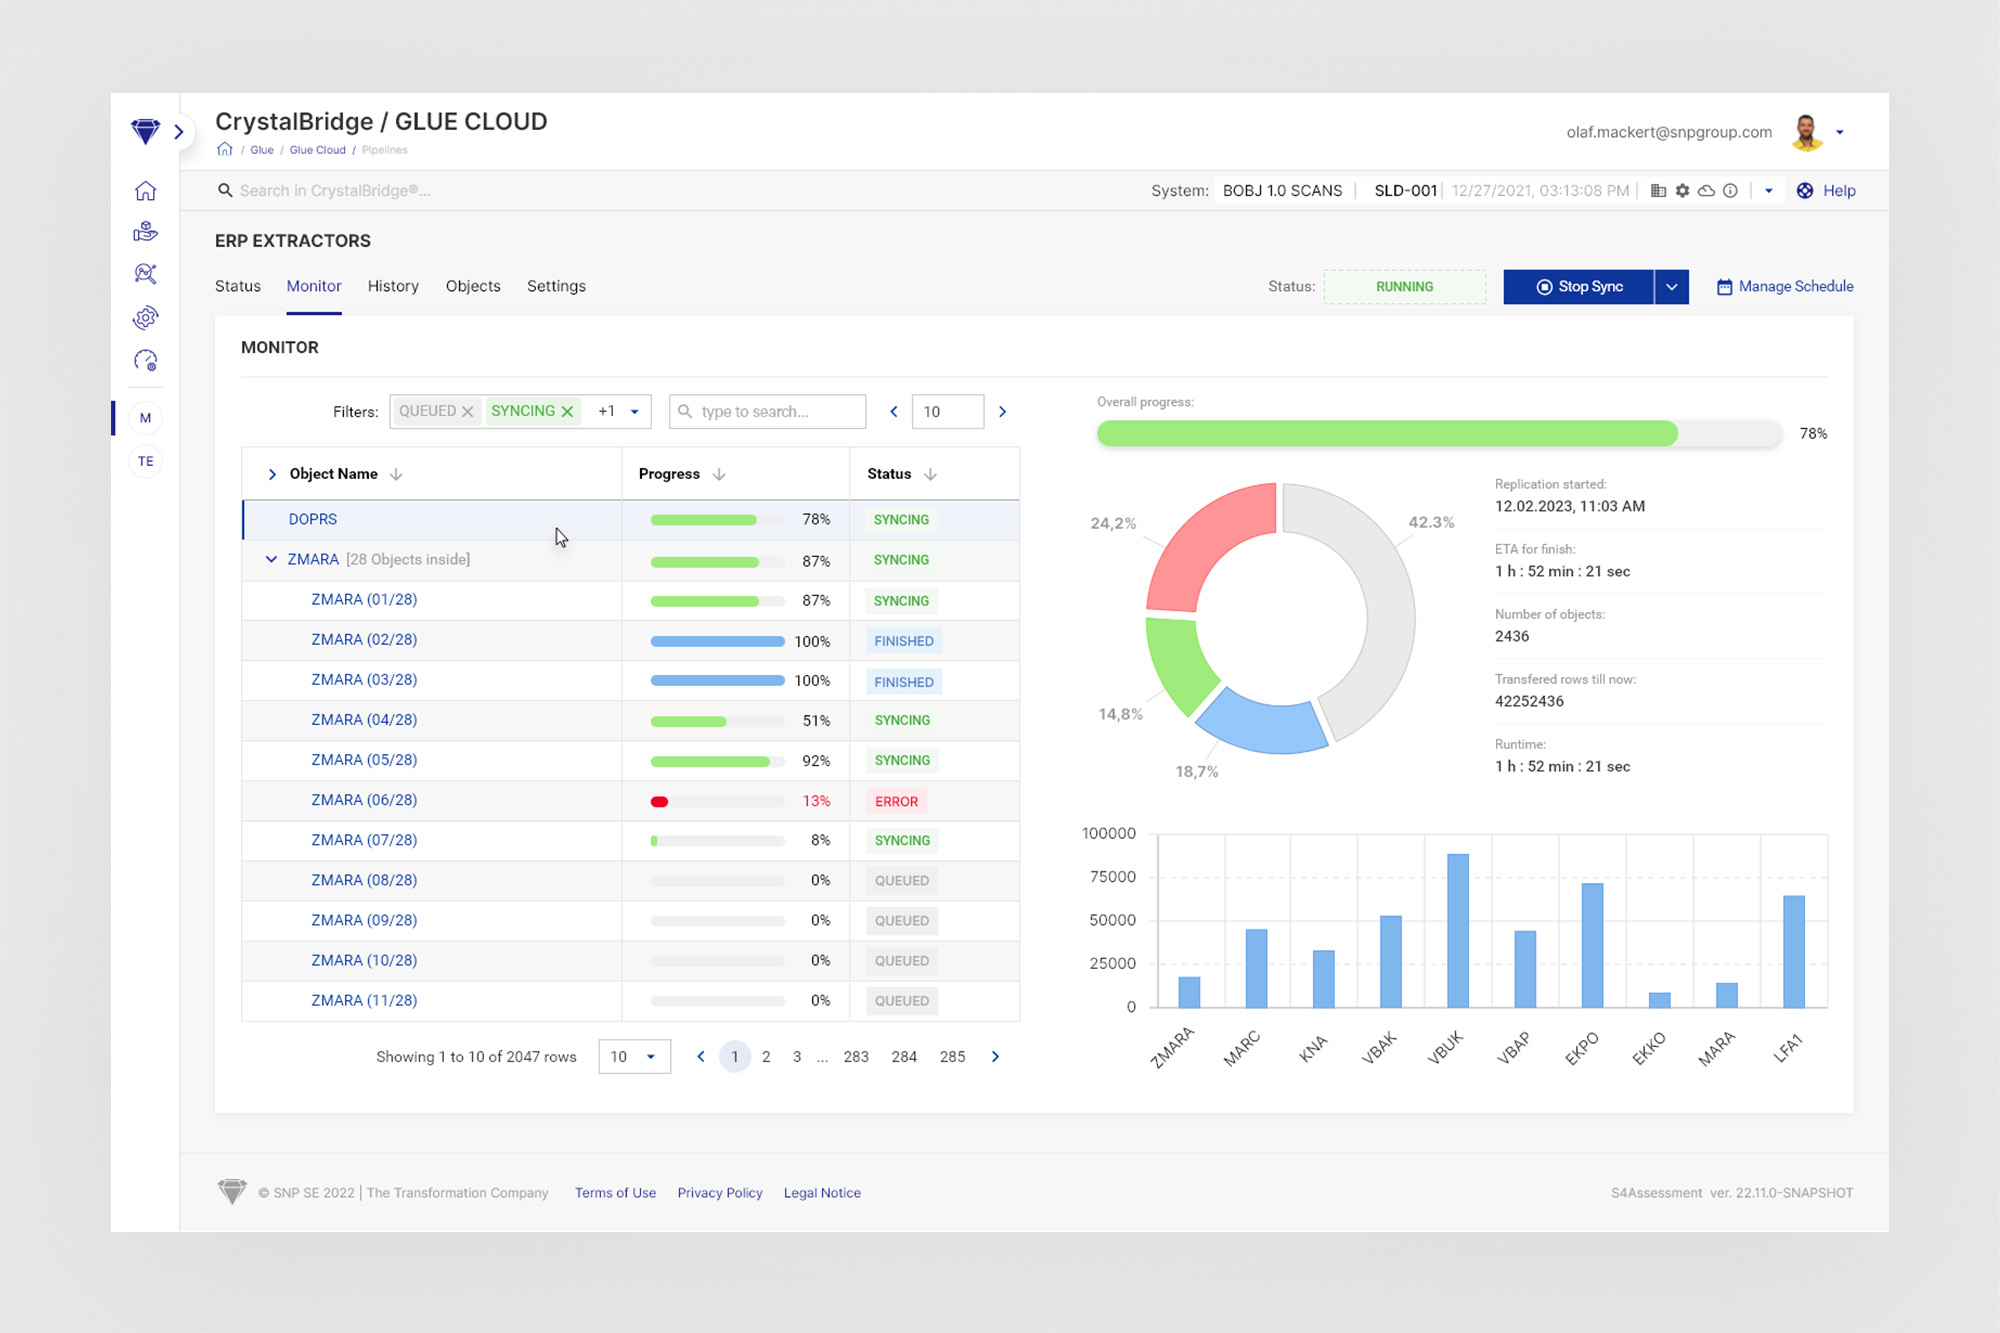
Pipeline detail - Status and Monitor tabs. Status shows connection details, a 24-hour syncing history timeline, user activity log, and alerts. Monitor shows per-object progress bars with status badges, overall completion donut chart, ETA, transferred row count, and a bar chart of object volumes.
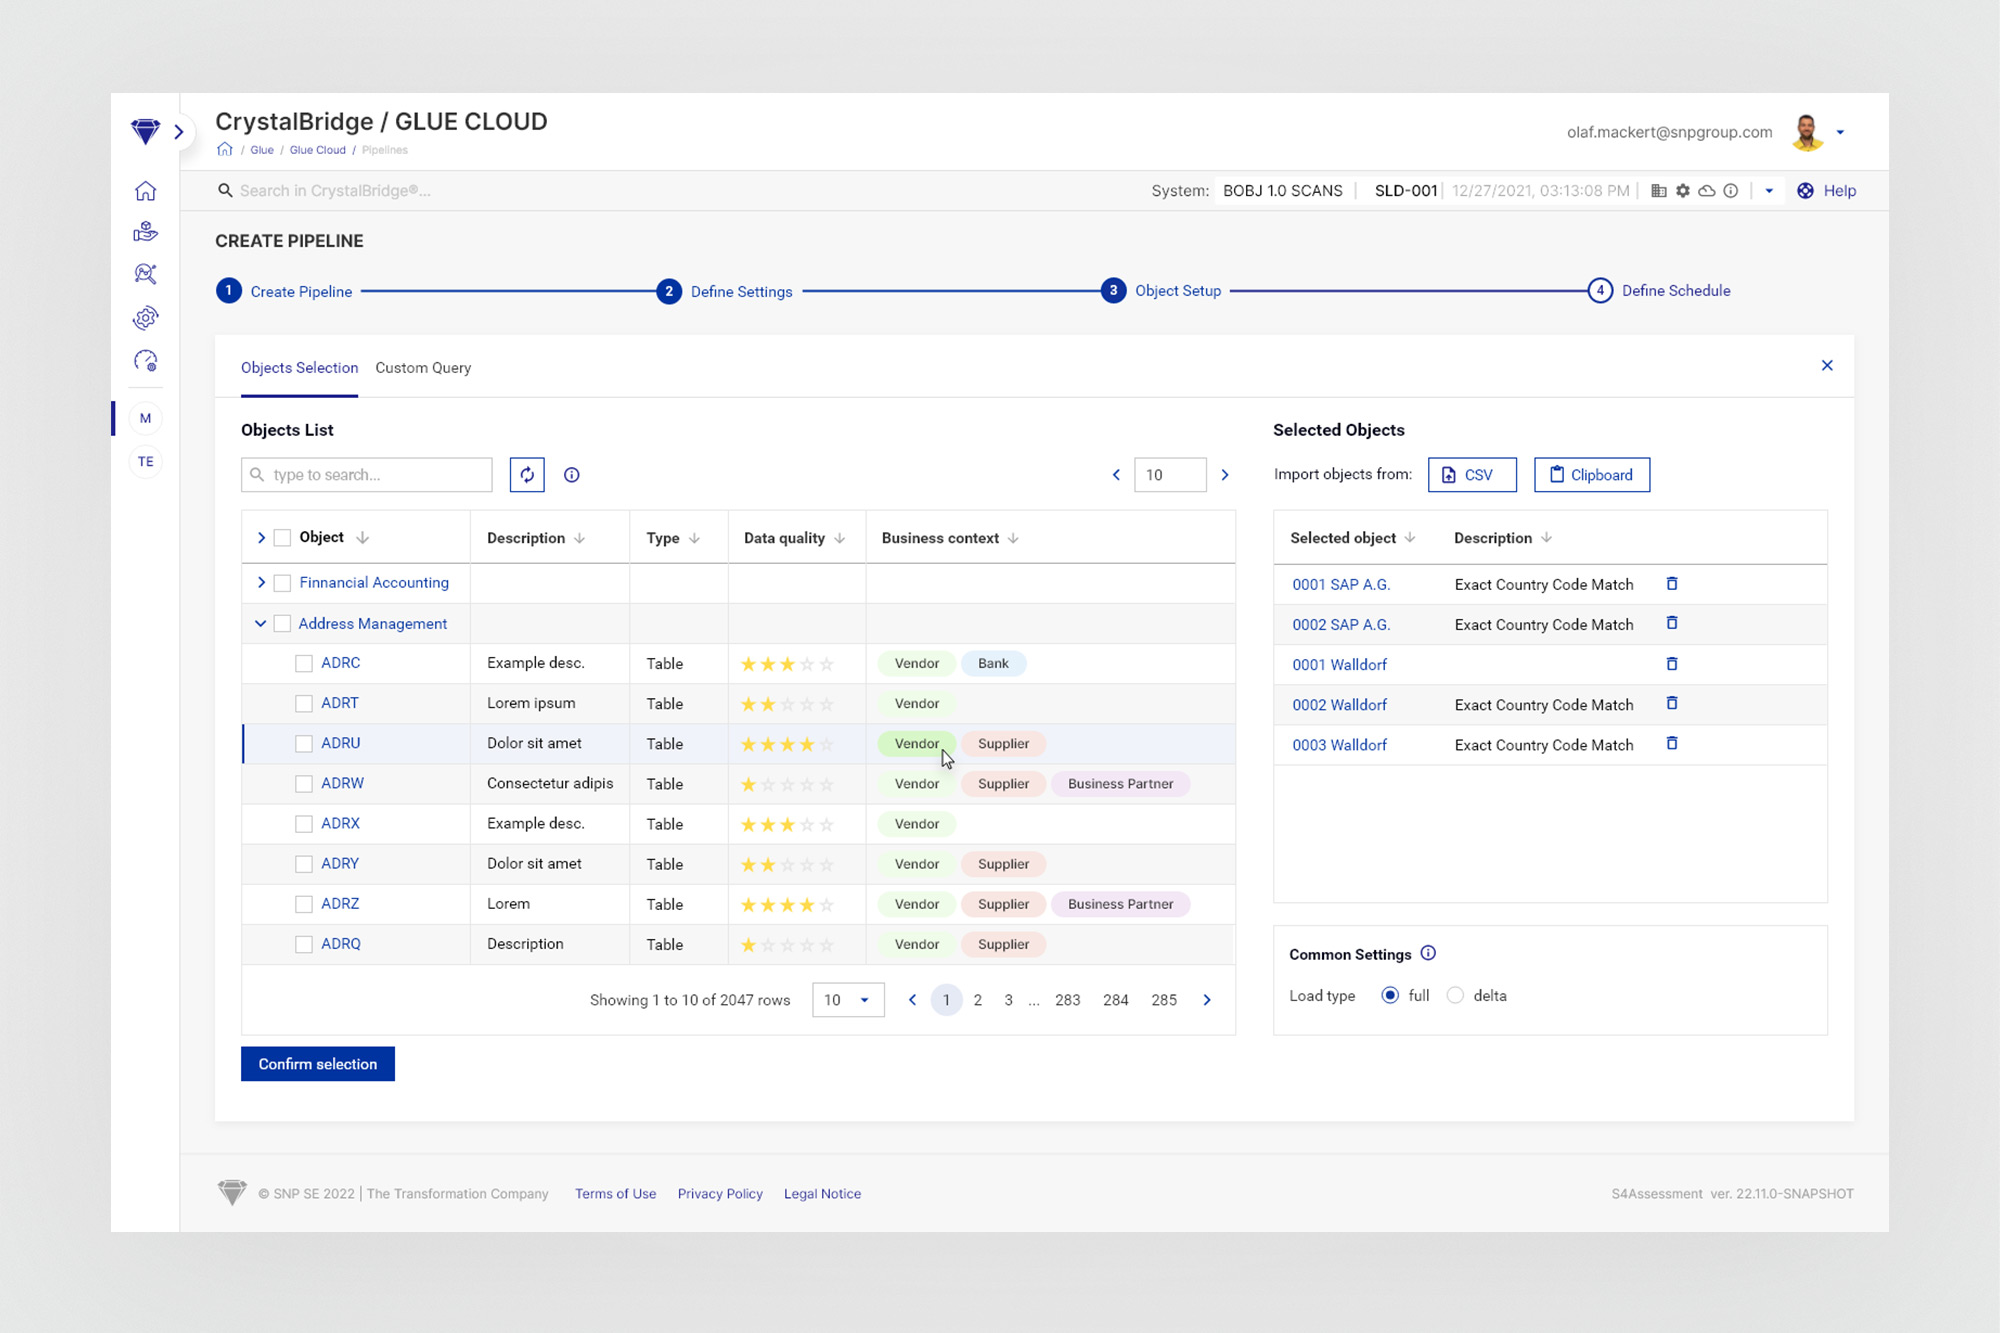
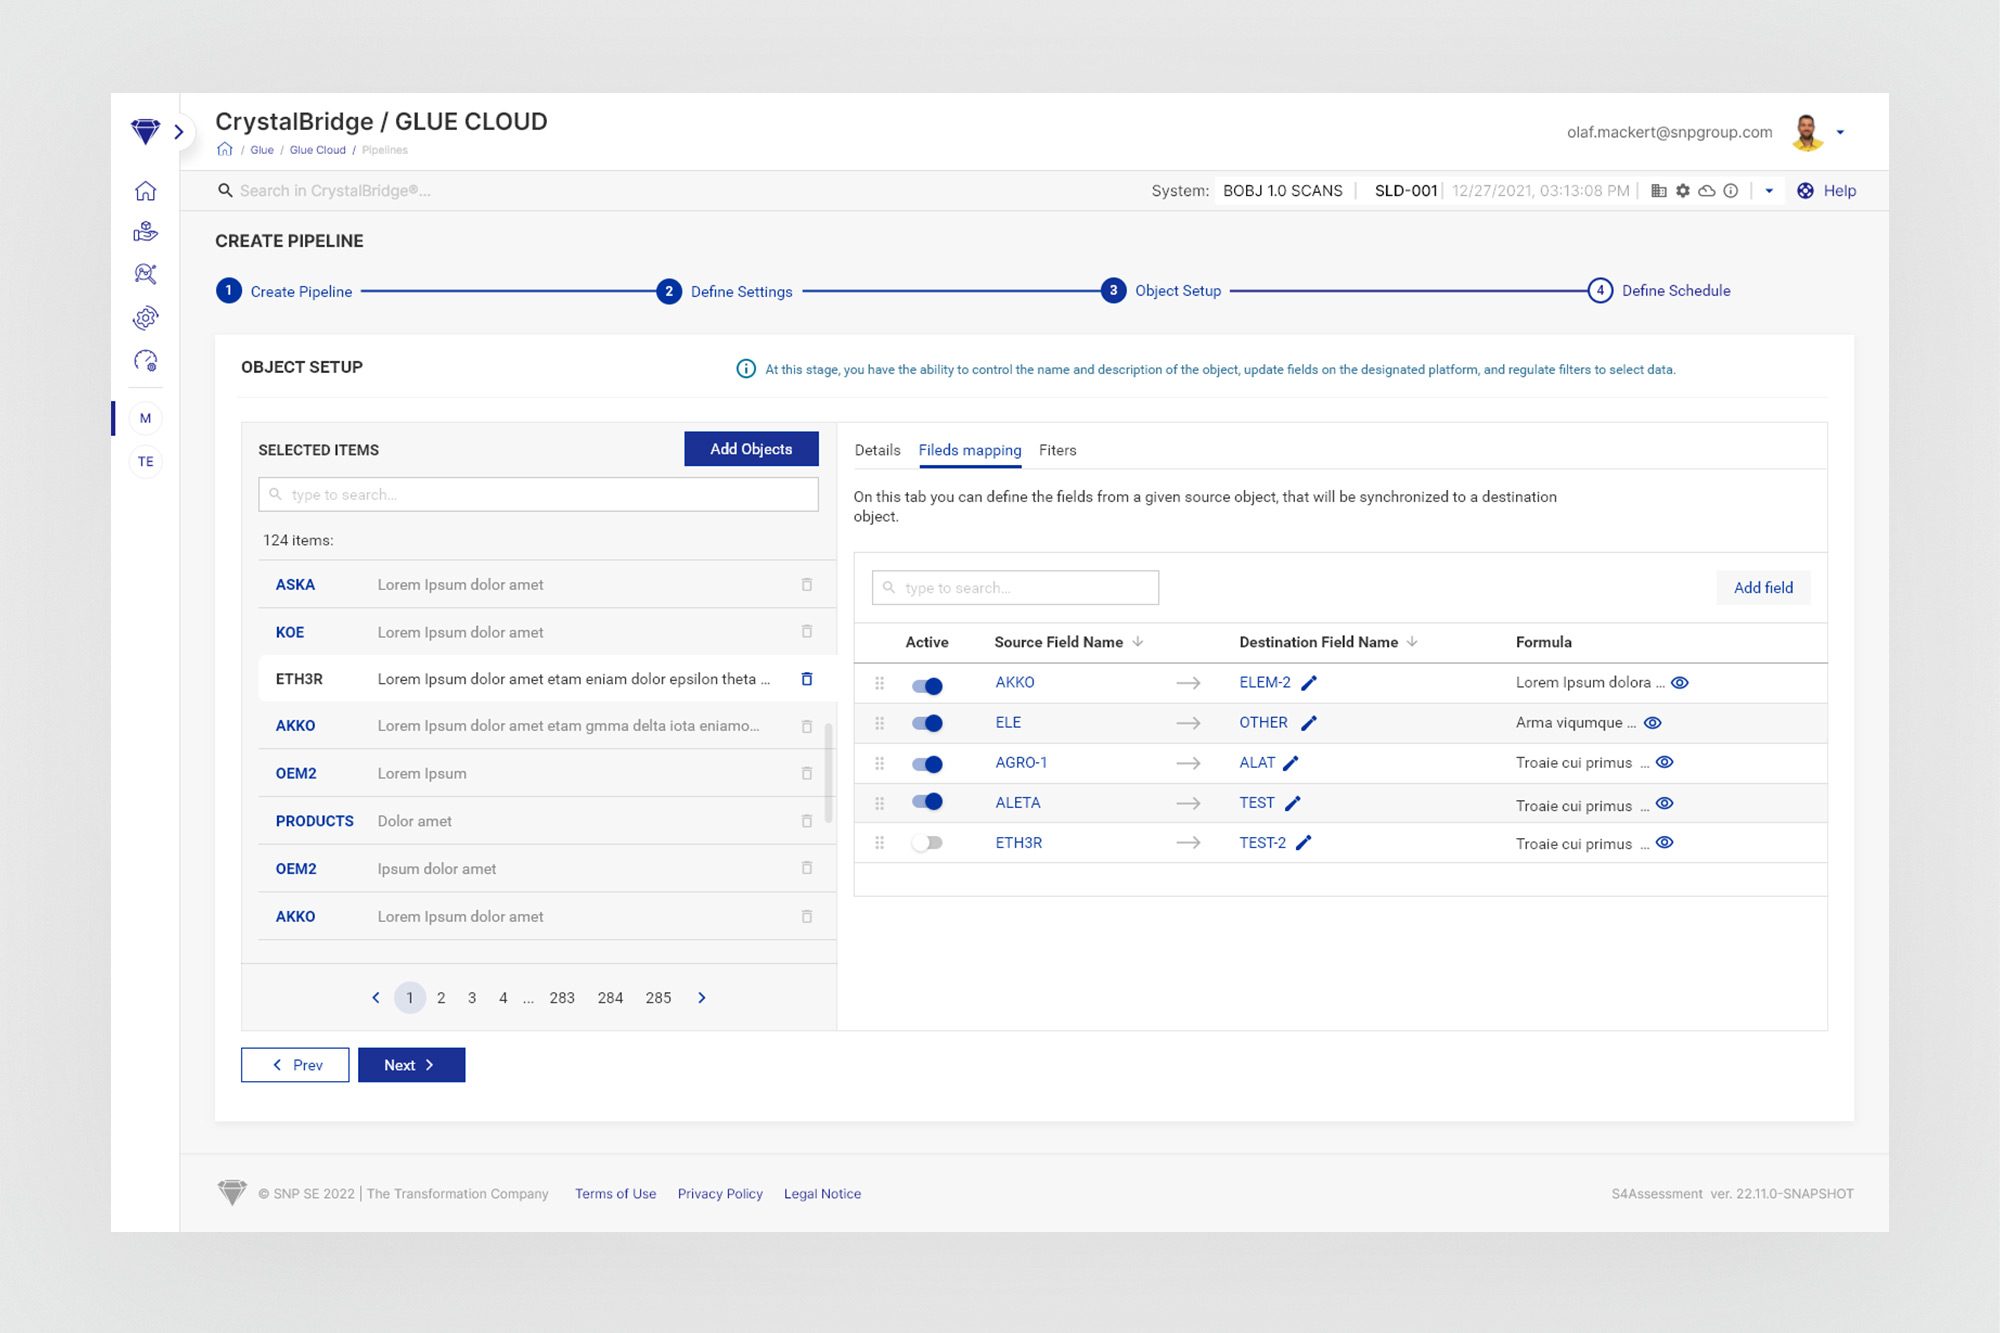
Create Pipeline wizard - Object Setup step. Left: dual-pane object selection - browse 2000+ source objects in a paginated, filterable table on the left; selected objects accumulate on the right with CSV/clipboard import option. Right: Fields Mapping tab within the same step - define source-to-destination field mappings with formula support per object.
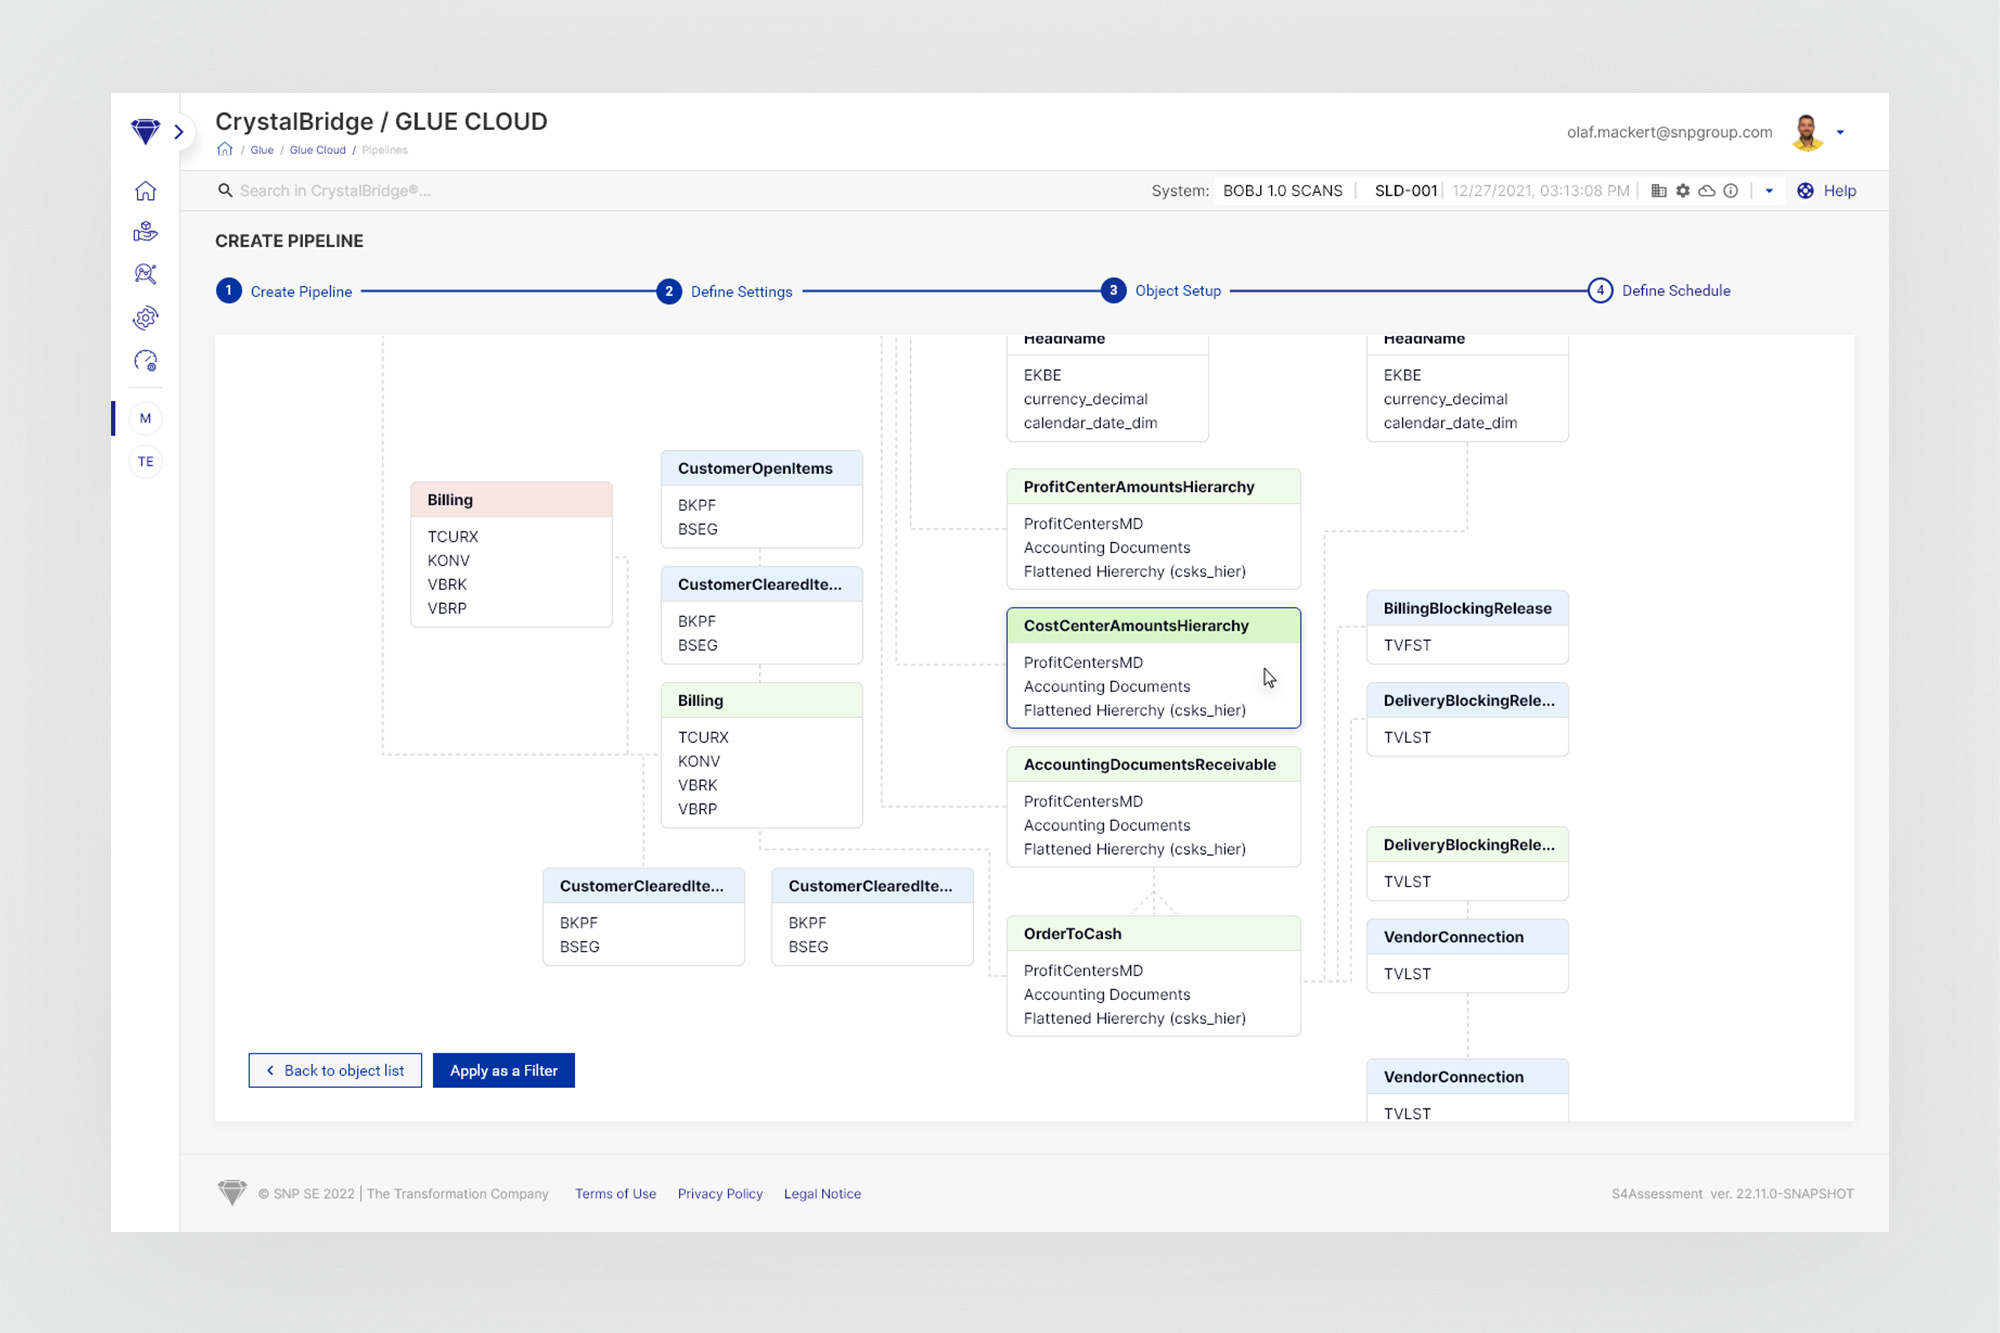
Object dependency view - a visual diagram showing relationships between selected SAP objects and their dependencies. Used during the Object Setup step to understand data model connections before confirming selections, and as a filter to scope the transformation scope.
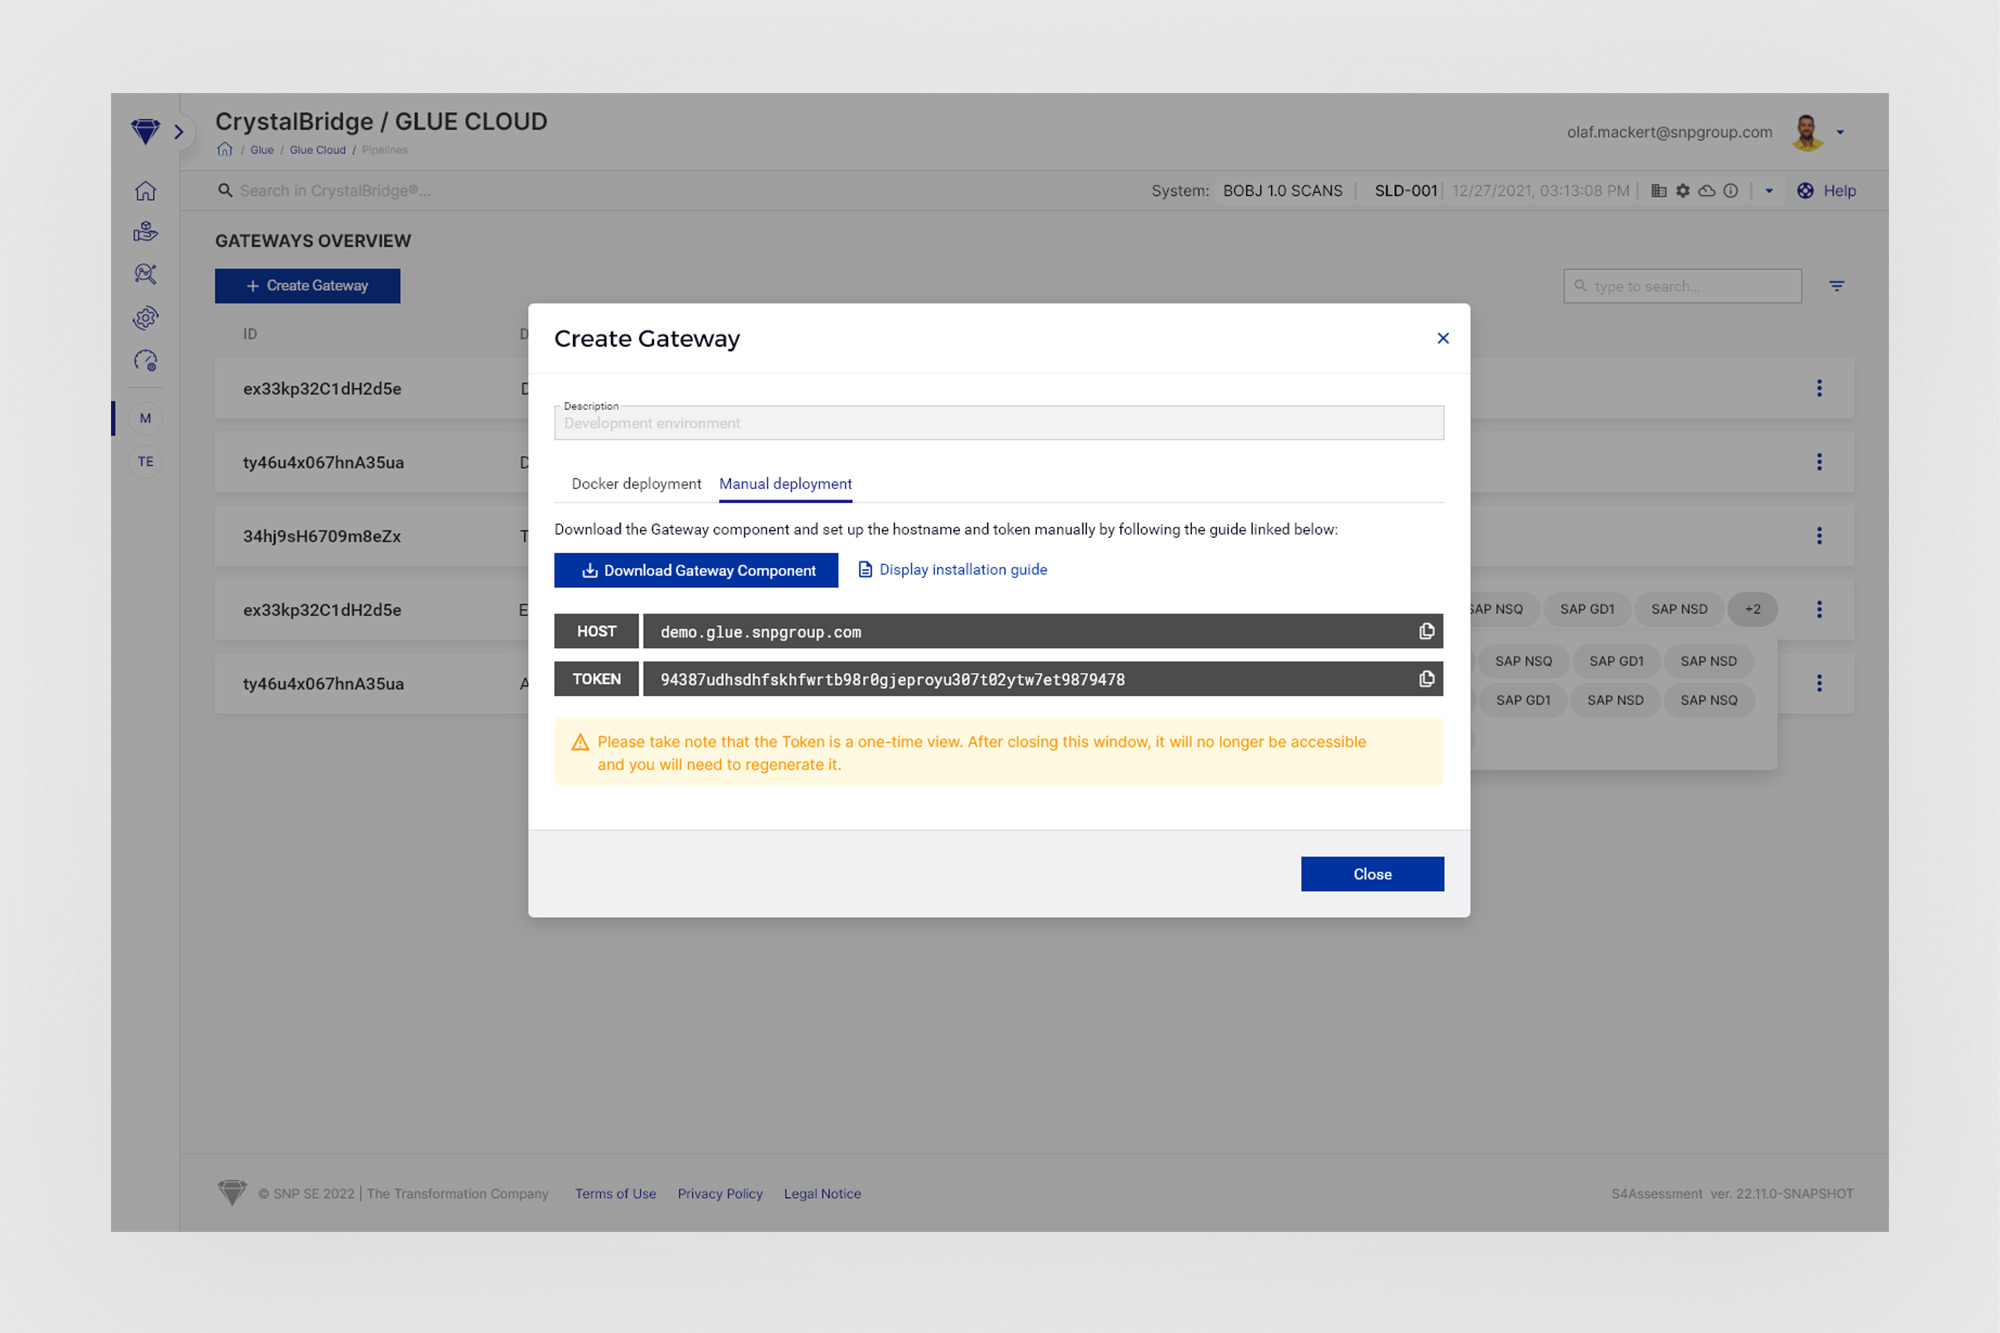
Gateways - the infrastructure connection layer. Create Gateway modal offers Docker deployment or manual deployment options, with auto-generated host/token credentials. The one-time token warning is handled with a clear contextual alert inside the modal.
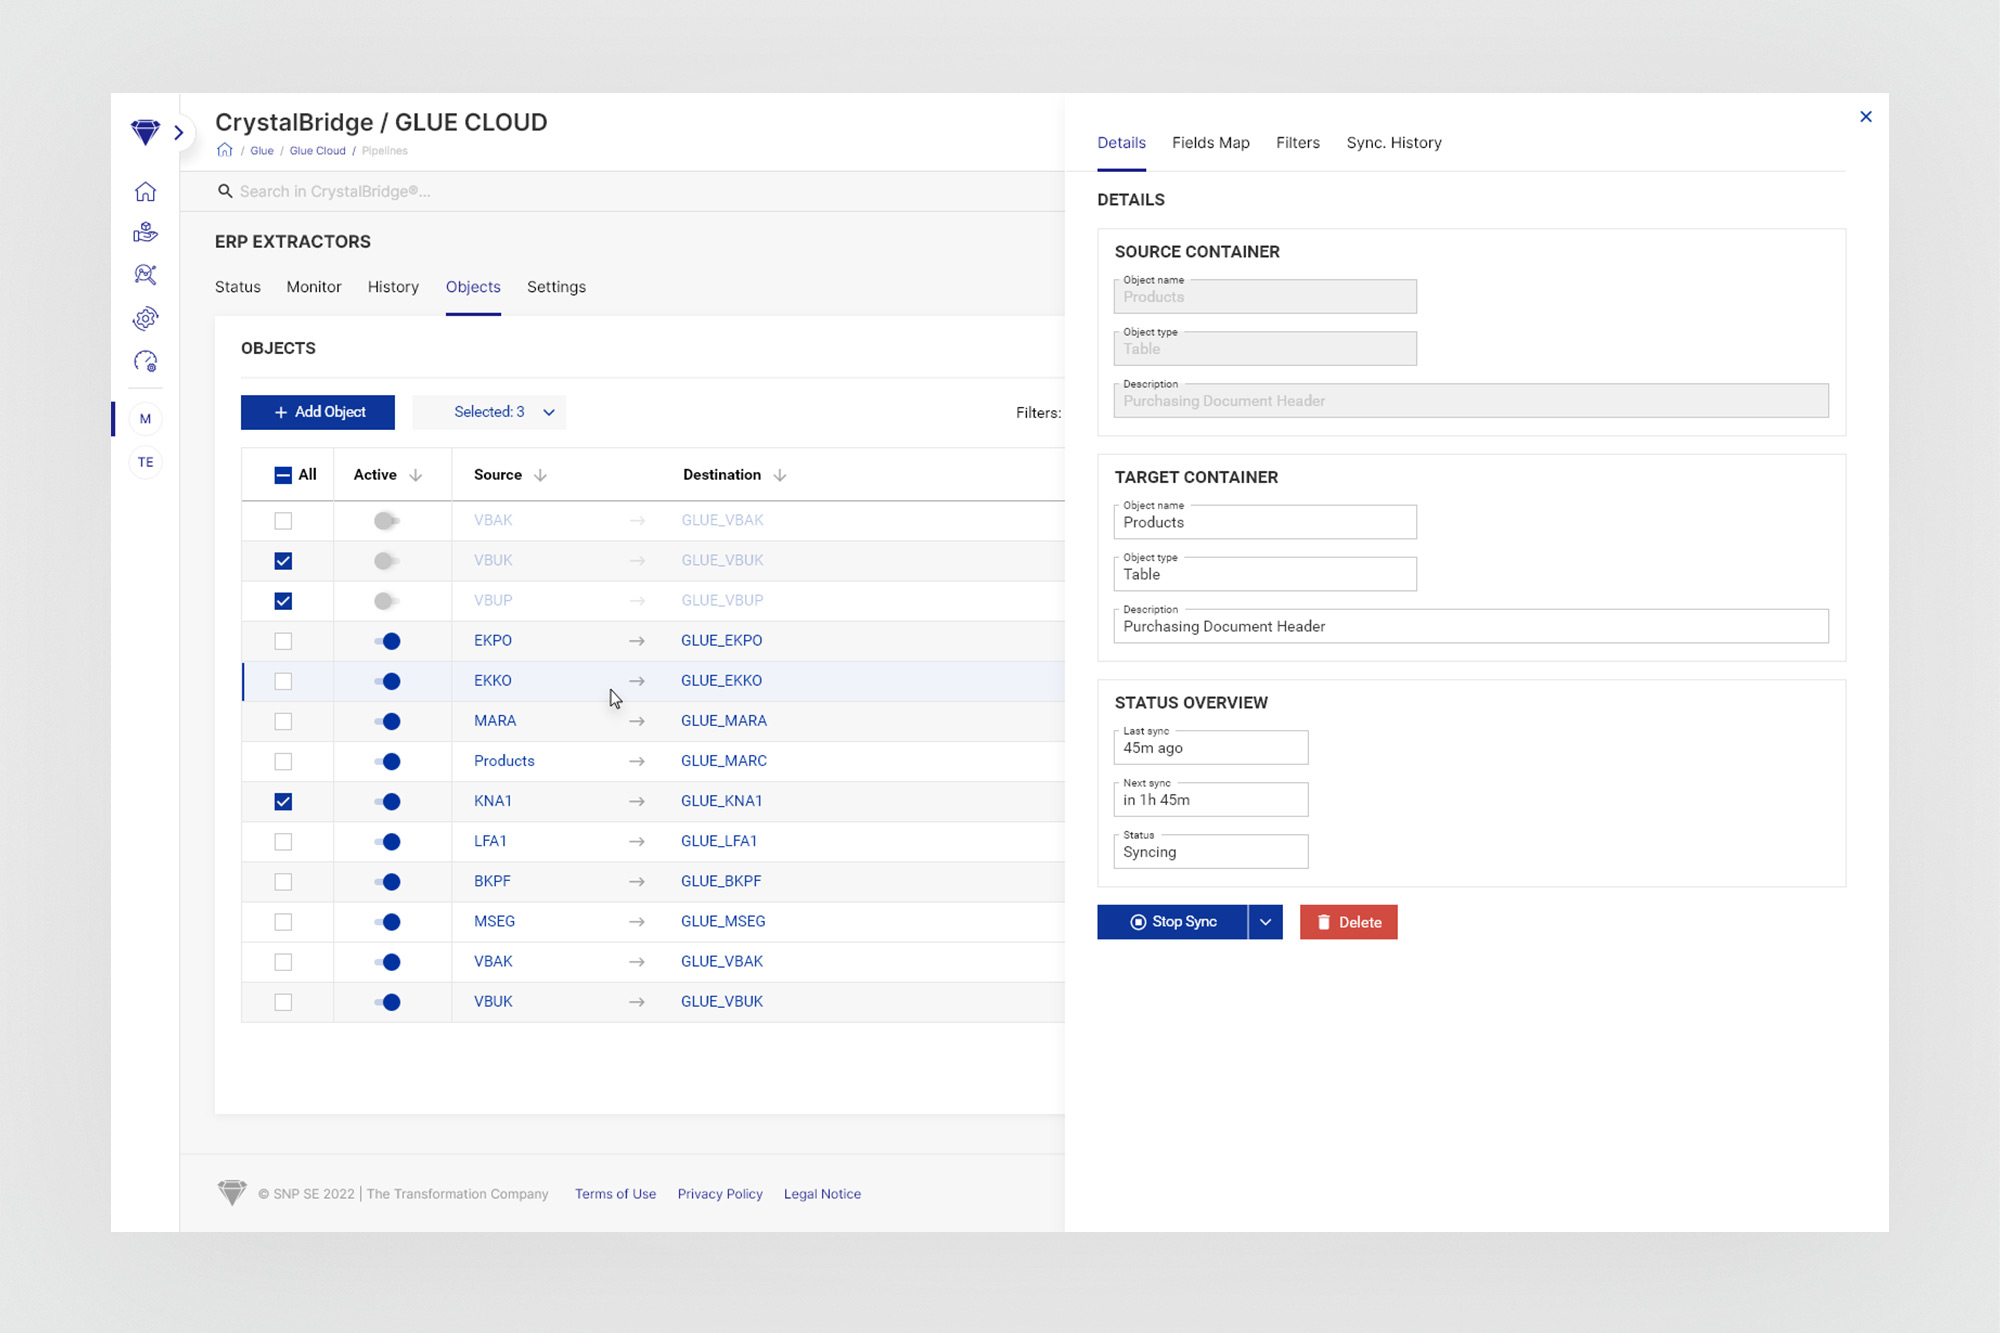
Objects tab with detail panel - the list of all objects within a pipeline, with active/inactive state toggles. Clicking any row opens a right-side detail panel showing source and target container metadata, sync schedule, status overview, and stop/delete controls - keeping the user in context without a full page navigation.
06. Outcomes
A production tool that didn't exist before.
Glue Cloud shipped as part of CrystalBridge 2.0 - a new module with no precedent in the platform's history. It became the operational interface through which transformation teams manage the data replication layer of live SAP projects.
07. Learnings
What designing a product from zero teaches me
Greenfield is discovery-heavy by nature. When there is no prior version to react to, a larger share of the work is definitional - figuring out what the product is, not just how it looks. Investing more time in the refinement and wireframing stages, before any visual design begins, pays off disproportionately when the scope is novel.
Wizards are a UX commitment, not a shortcut. Breaking a complex configuration flow into a wizard feels like a solution to complexity - but it only works if each step is genuinely self-contained, progress is truly preserved, and the user can freely move backwards without losing work. Designing the Glue Cloud pipeline creation wizard revealed how many edge cases emerge when you take that promise seriously.
Monitoring UX is a distinct discipline. Displaying the status of a running process is a very different problem from displaying a data record. Time, progress, failure modes, and alerting all introduce design decisions that don't appear in static data interfaces. The Monitor tab took more iteration than any other screen in the module.
The design system is an anchor, not a constraint. Designing a new product within an existing system could feel restrictive - but the CrystalBridge 2.0 design system provided a consistent baseline that made every decision faster. When a new pattern genuinely couldn't be satisfied by existing components, that was a signal worth examining: it usually meant the problem wasn't fully understood yet.