SAP transformations

SAP transformations
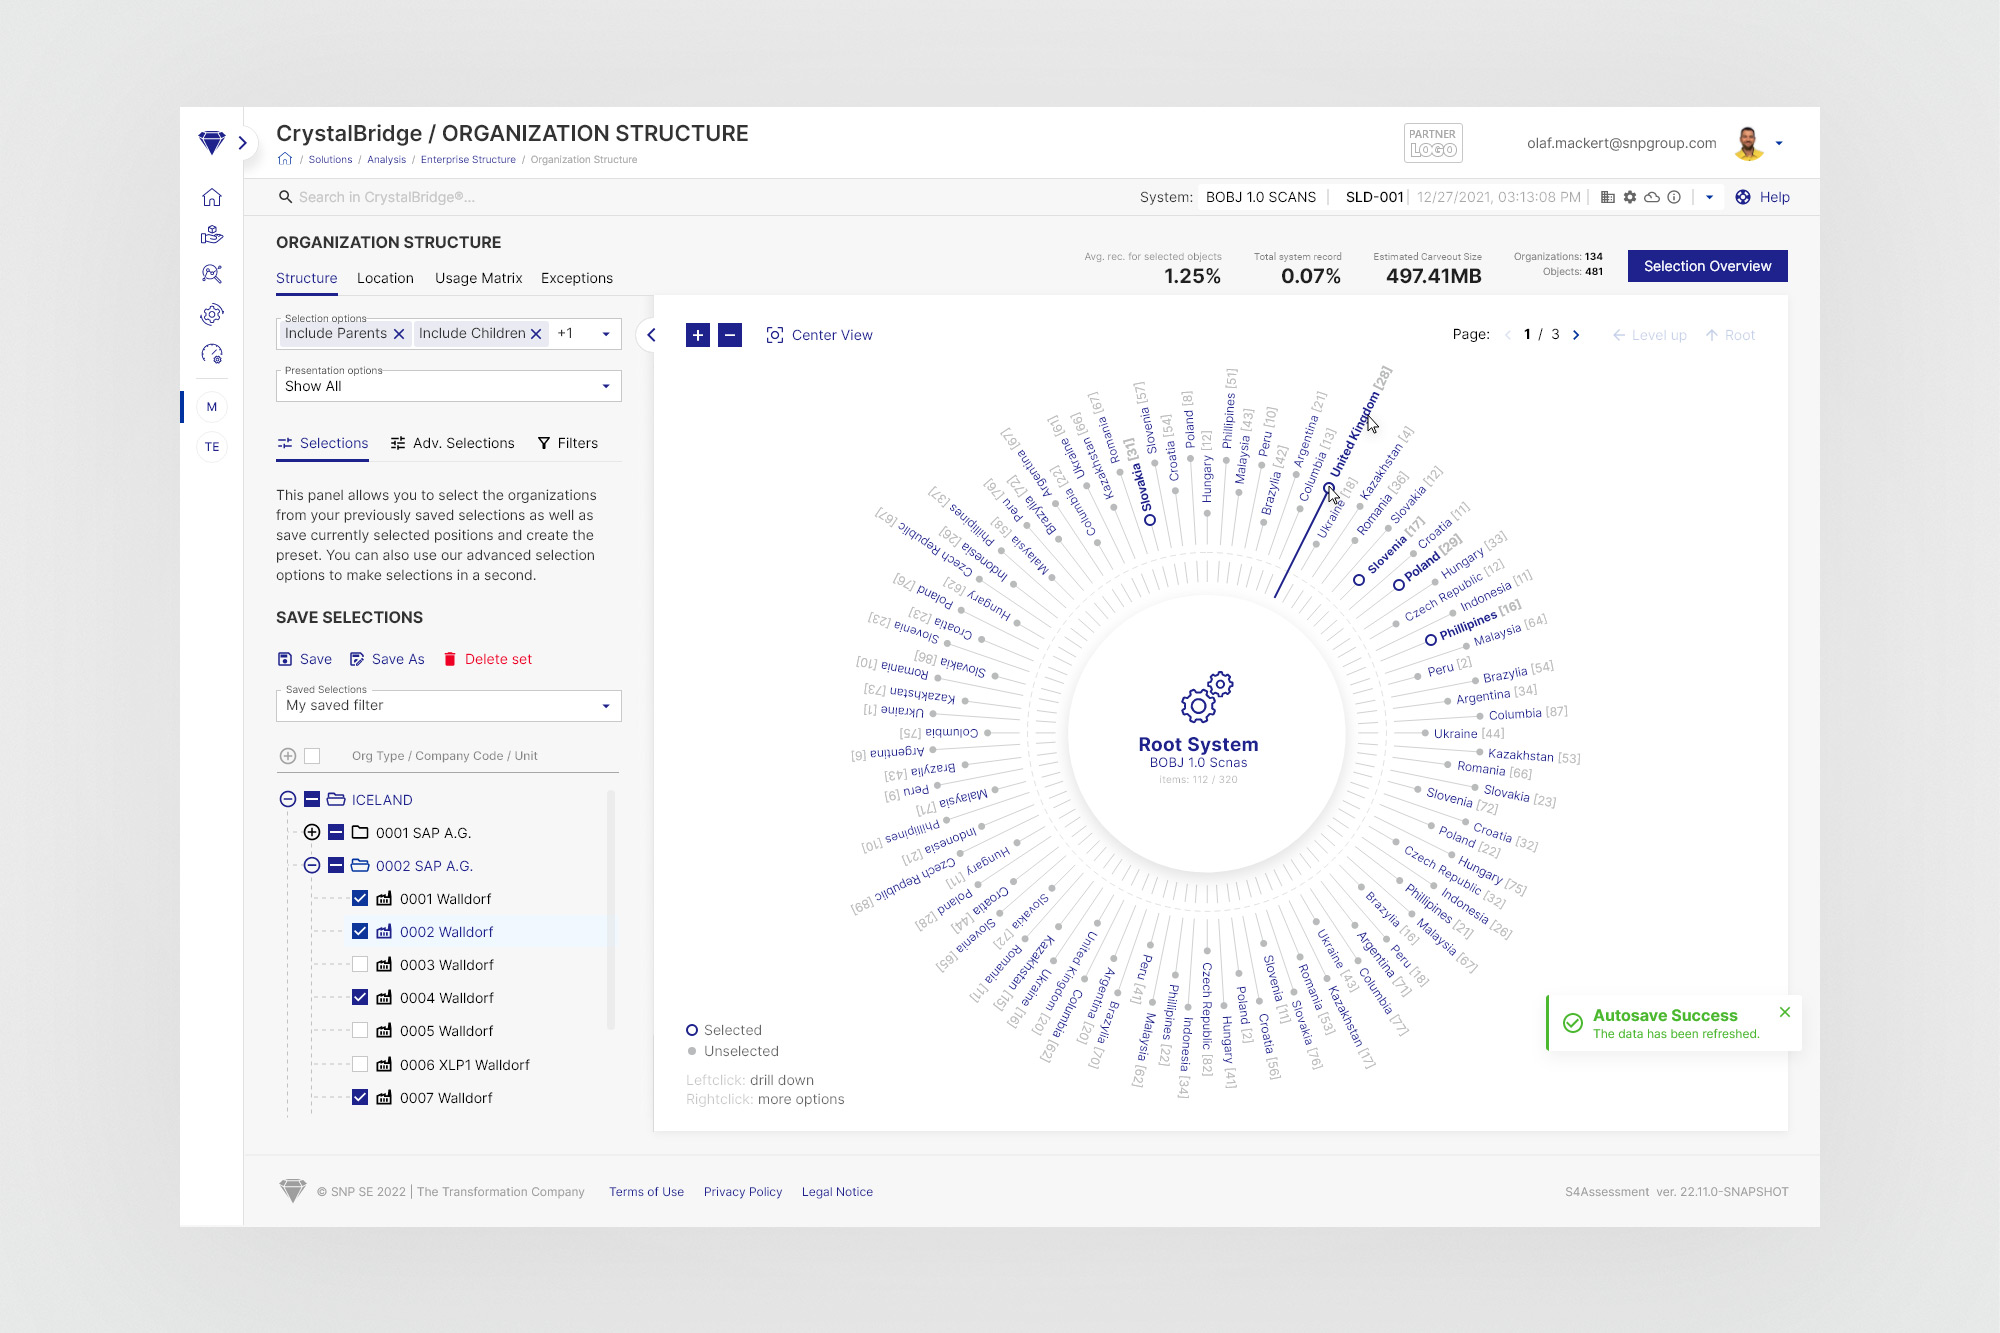
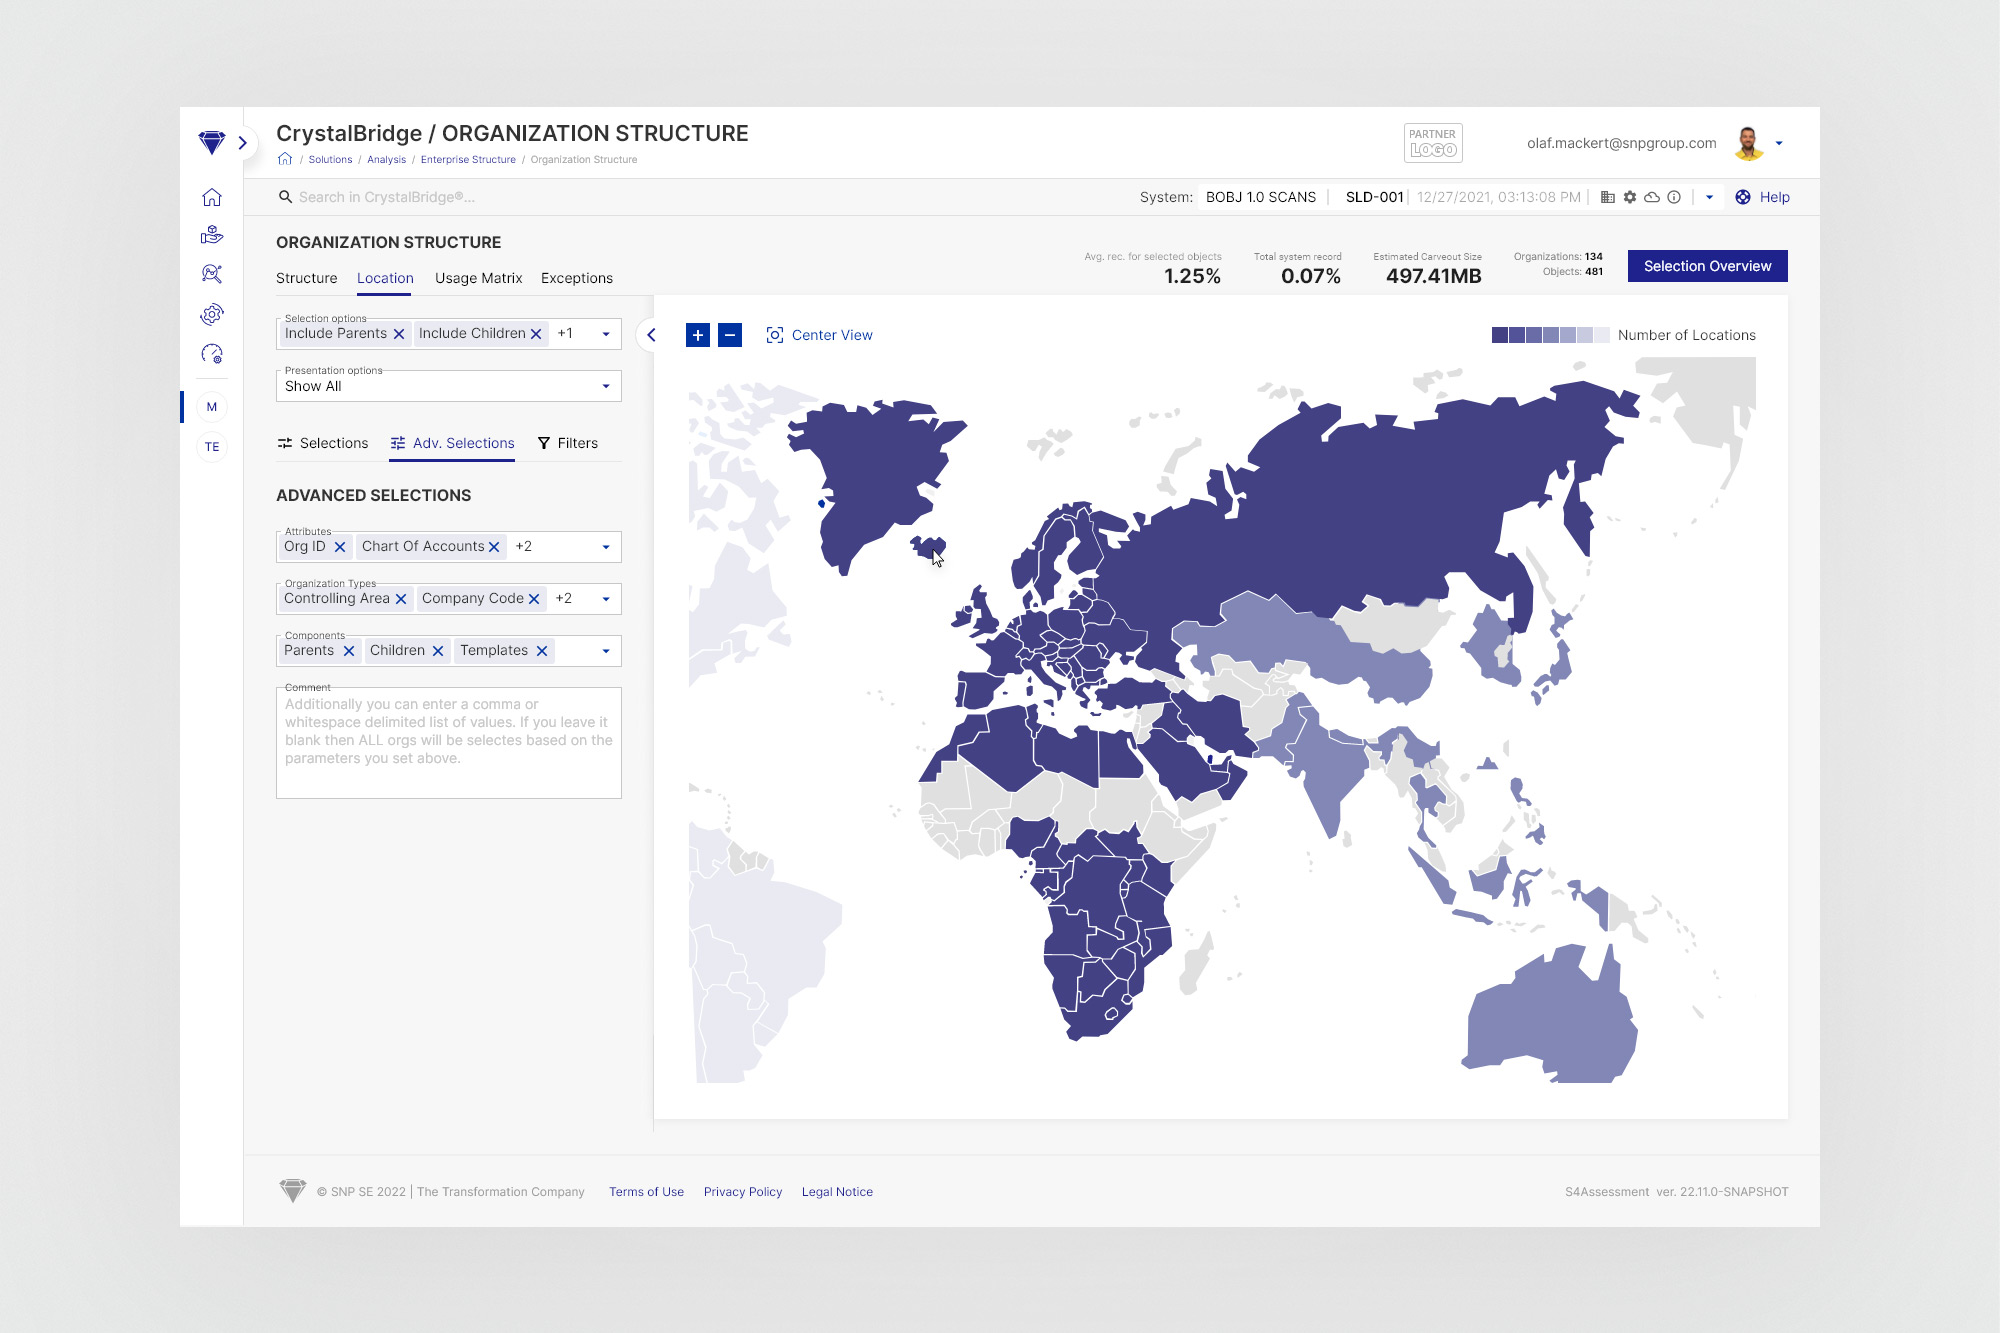
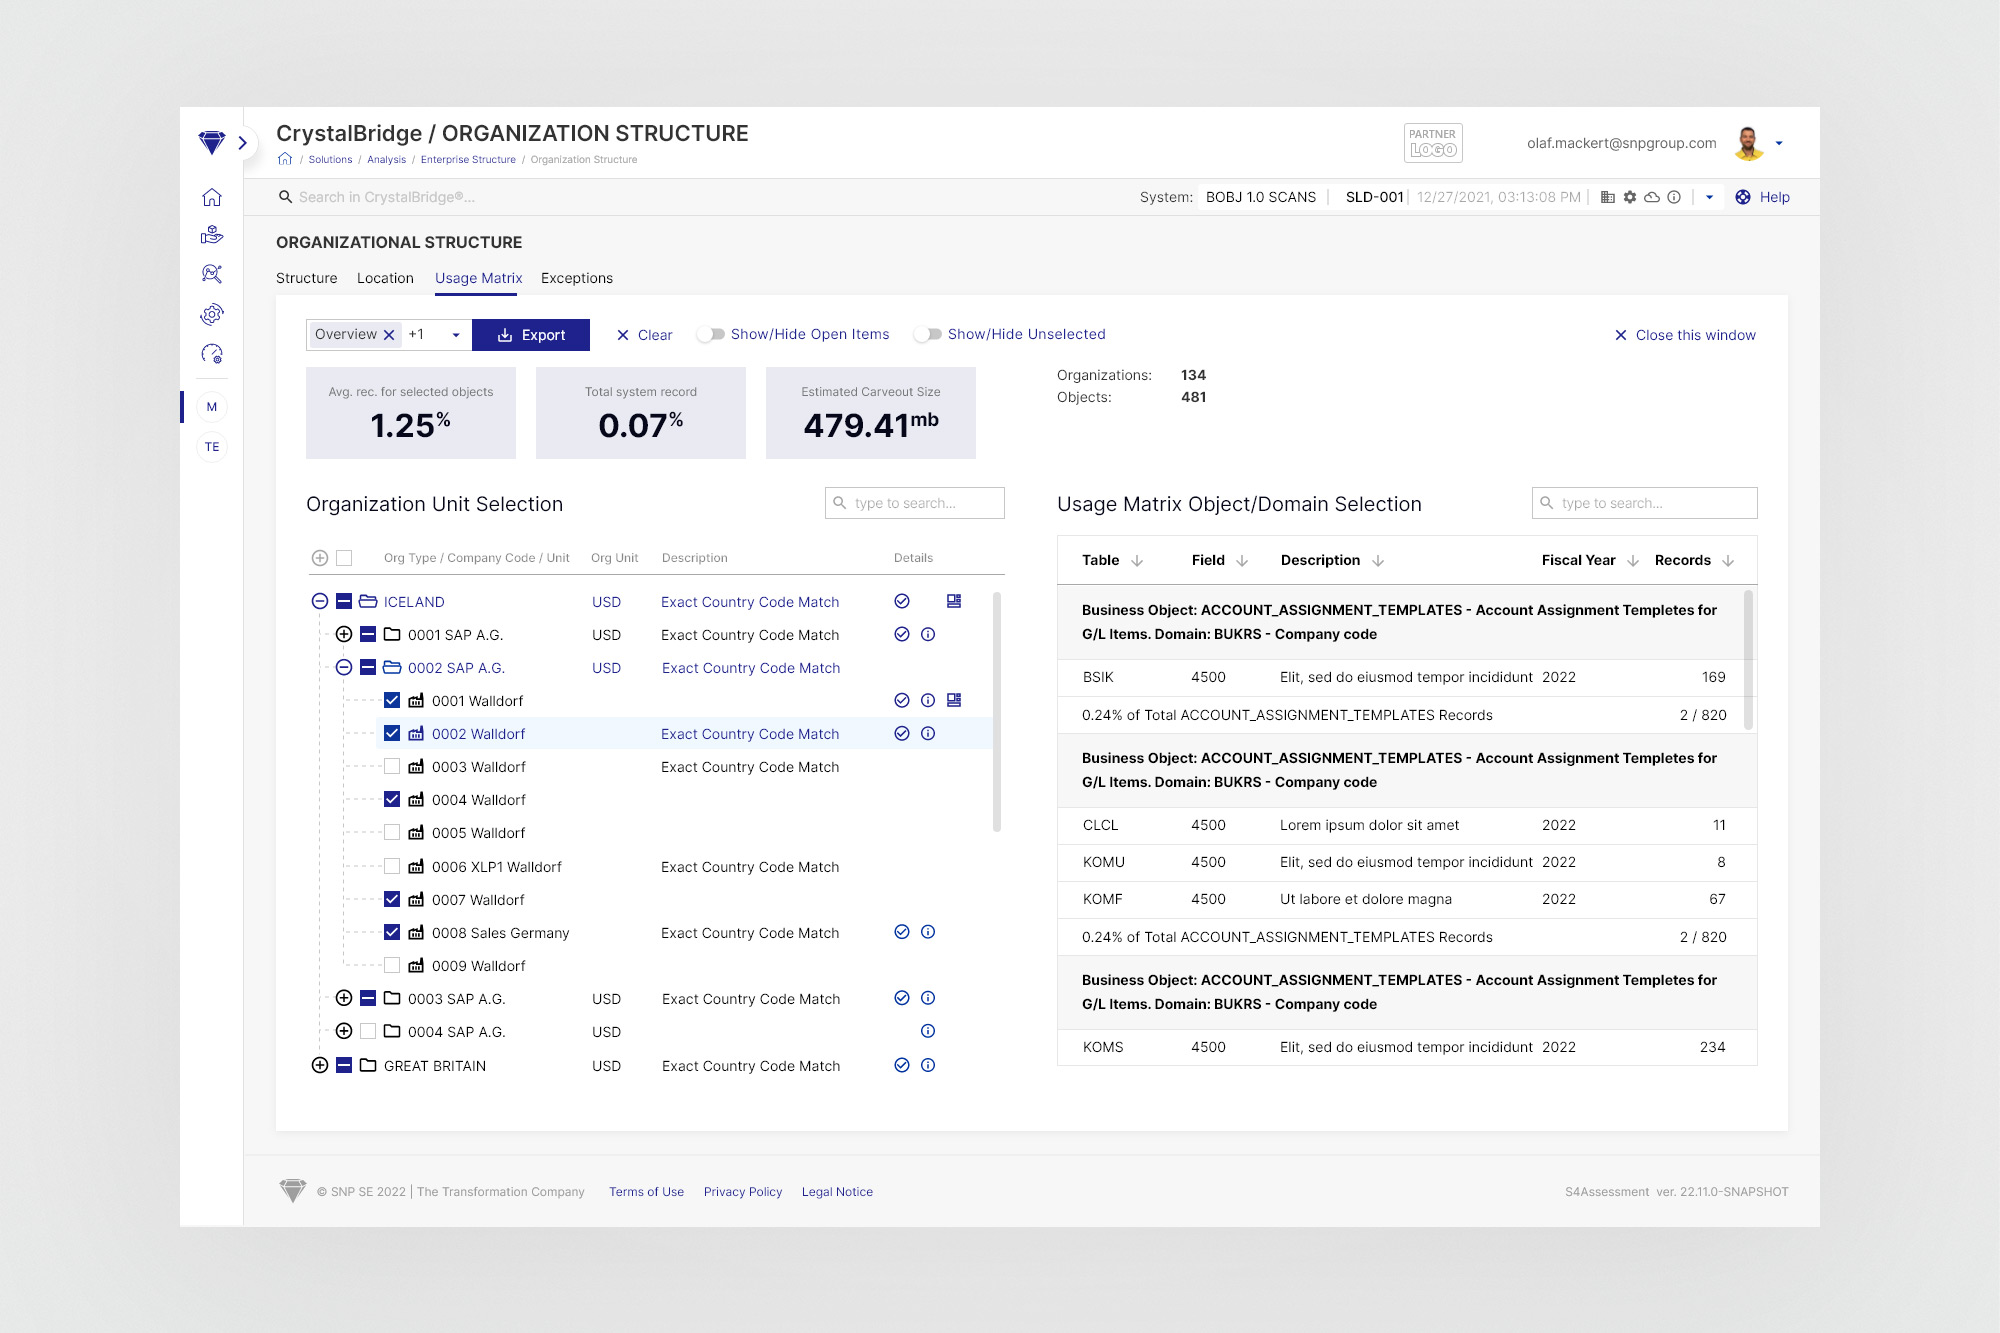
Initially, there were three independent pages on the Crystal Bridge website serving very similar purposes - they allowed for the selection and filtering of appropriately structured data, which was further presented in a circle chart, matrix or in the form of a heat map.
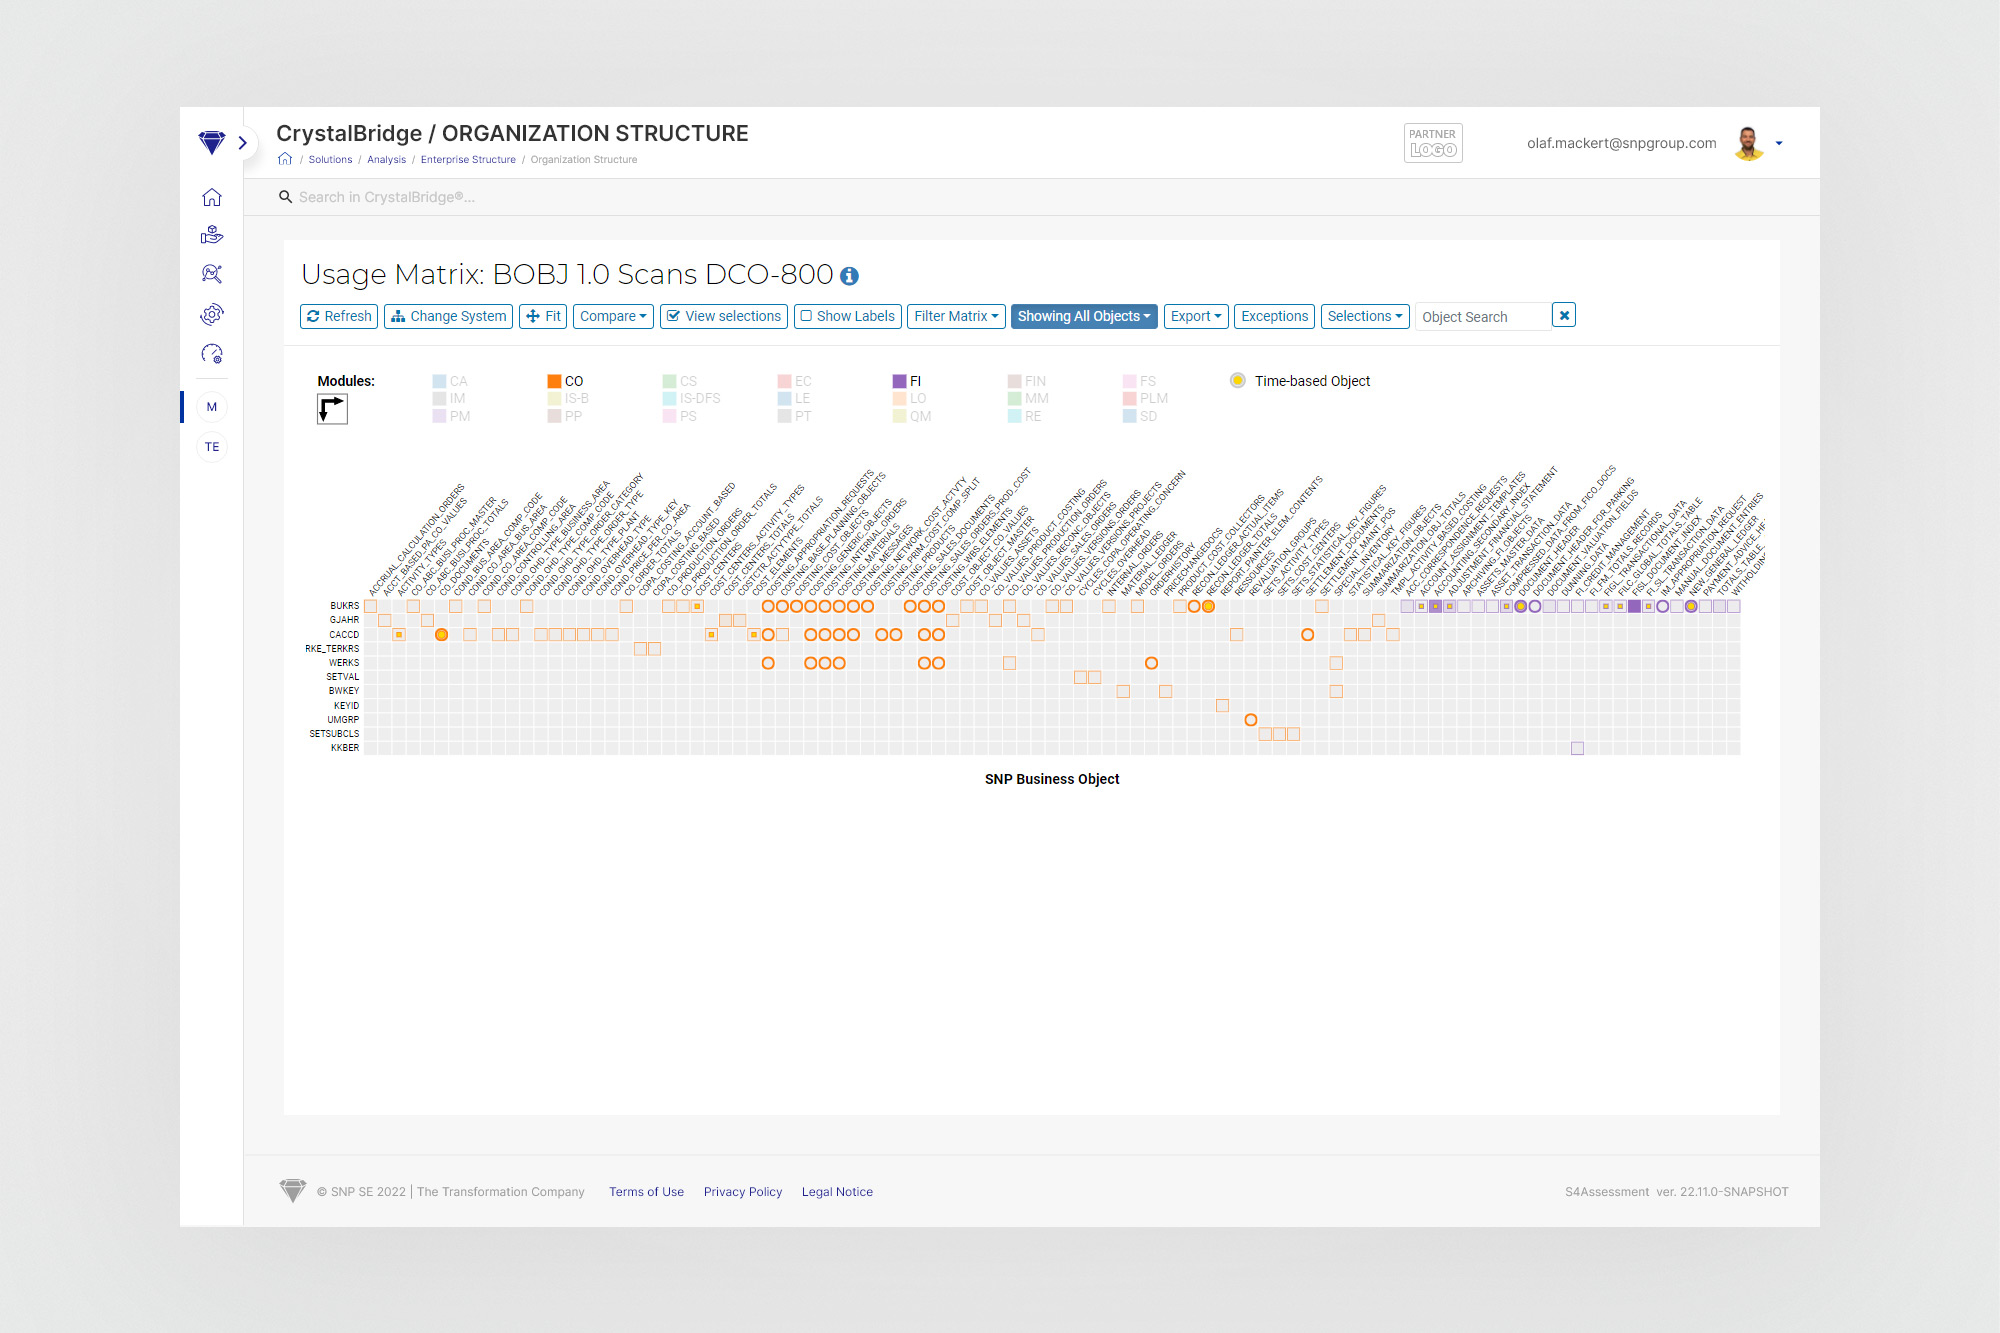
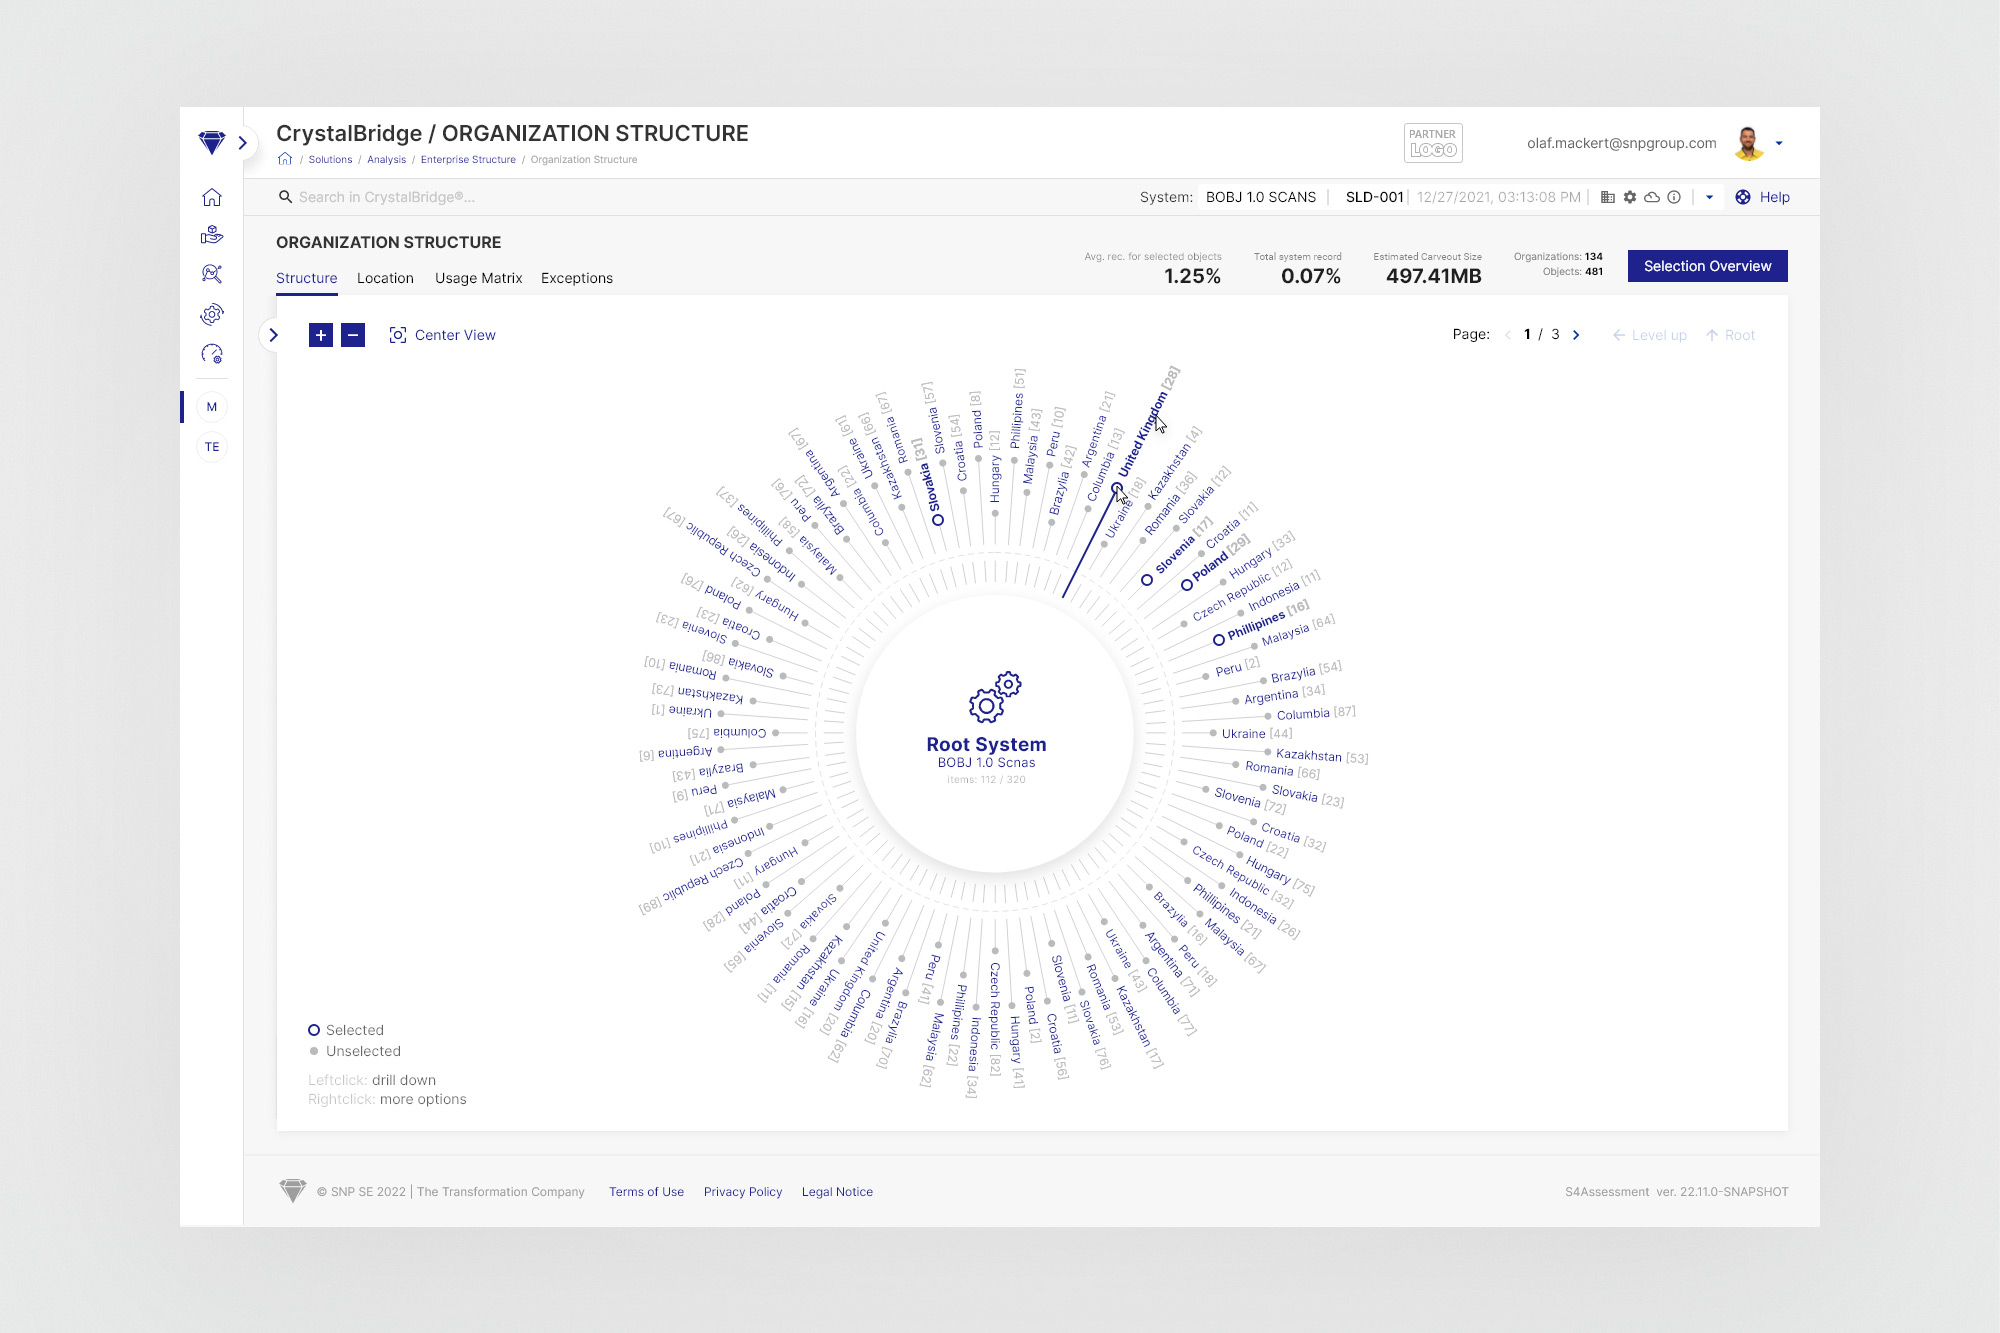
Such scattering of similar functionalities in different places was not useful and also took additional waiting time for website reloads. Because, depending on the category of data needed, the user was forced to switch to different subpages each time, he also had to set selections and filters again. An additional problem was the low readability of the charts given the large number of elements on them - navigation was sometimes practically impossible without using the zoom-in and out option.
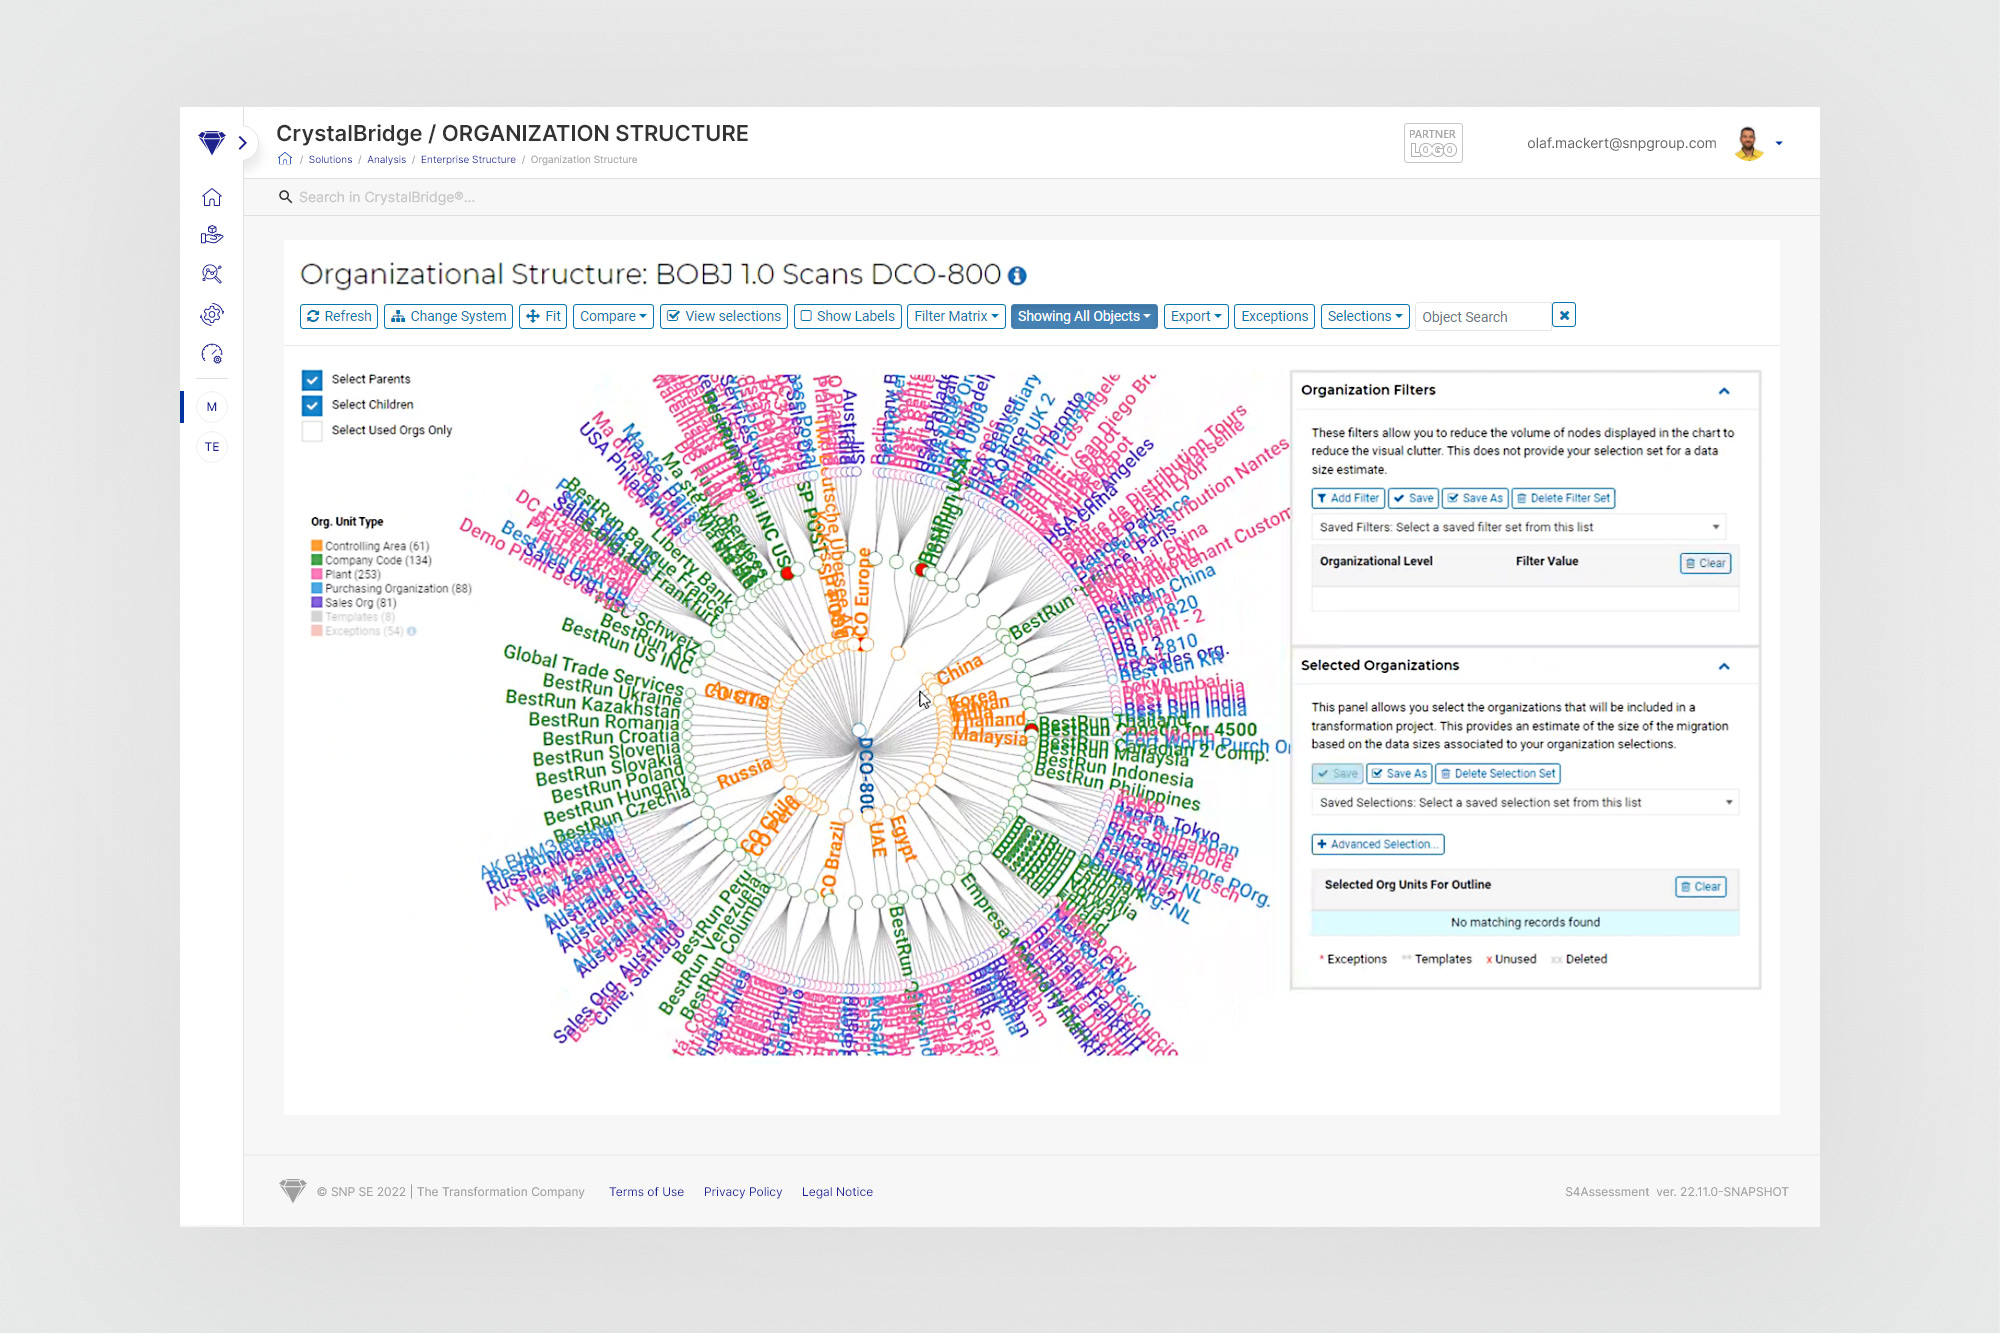
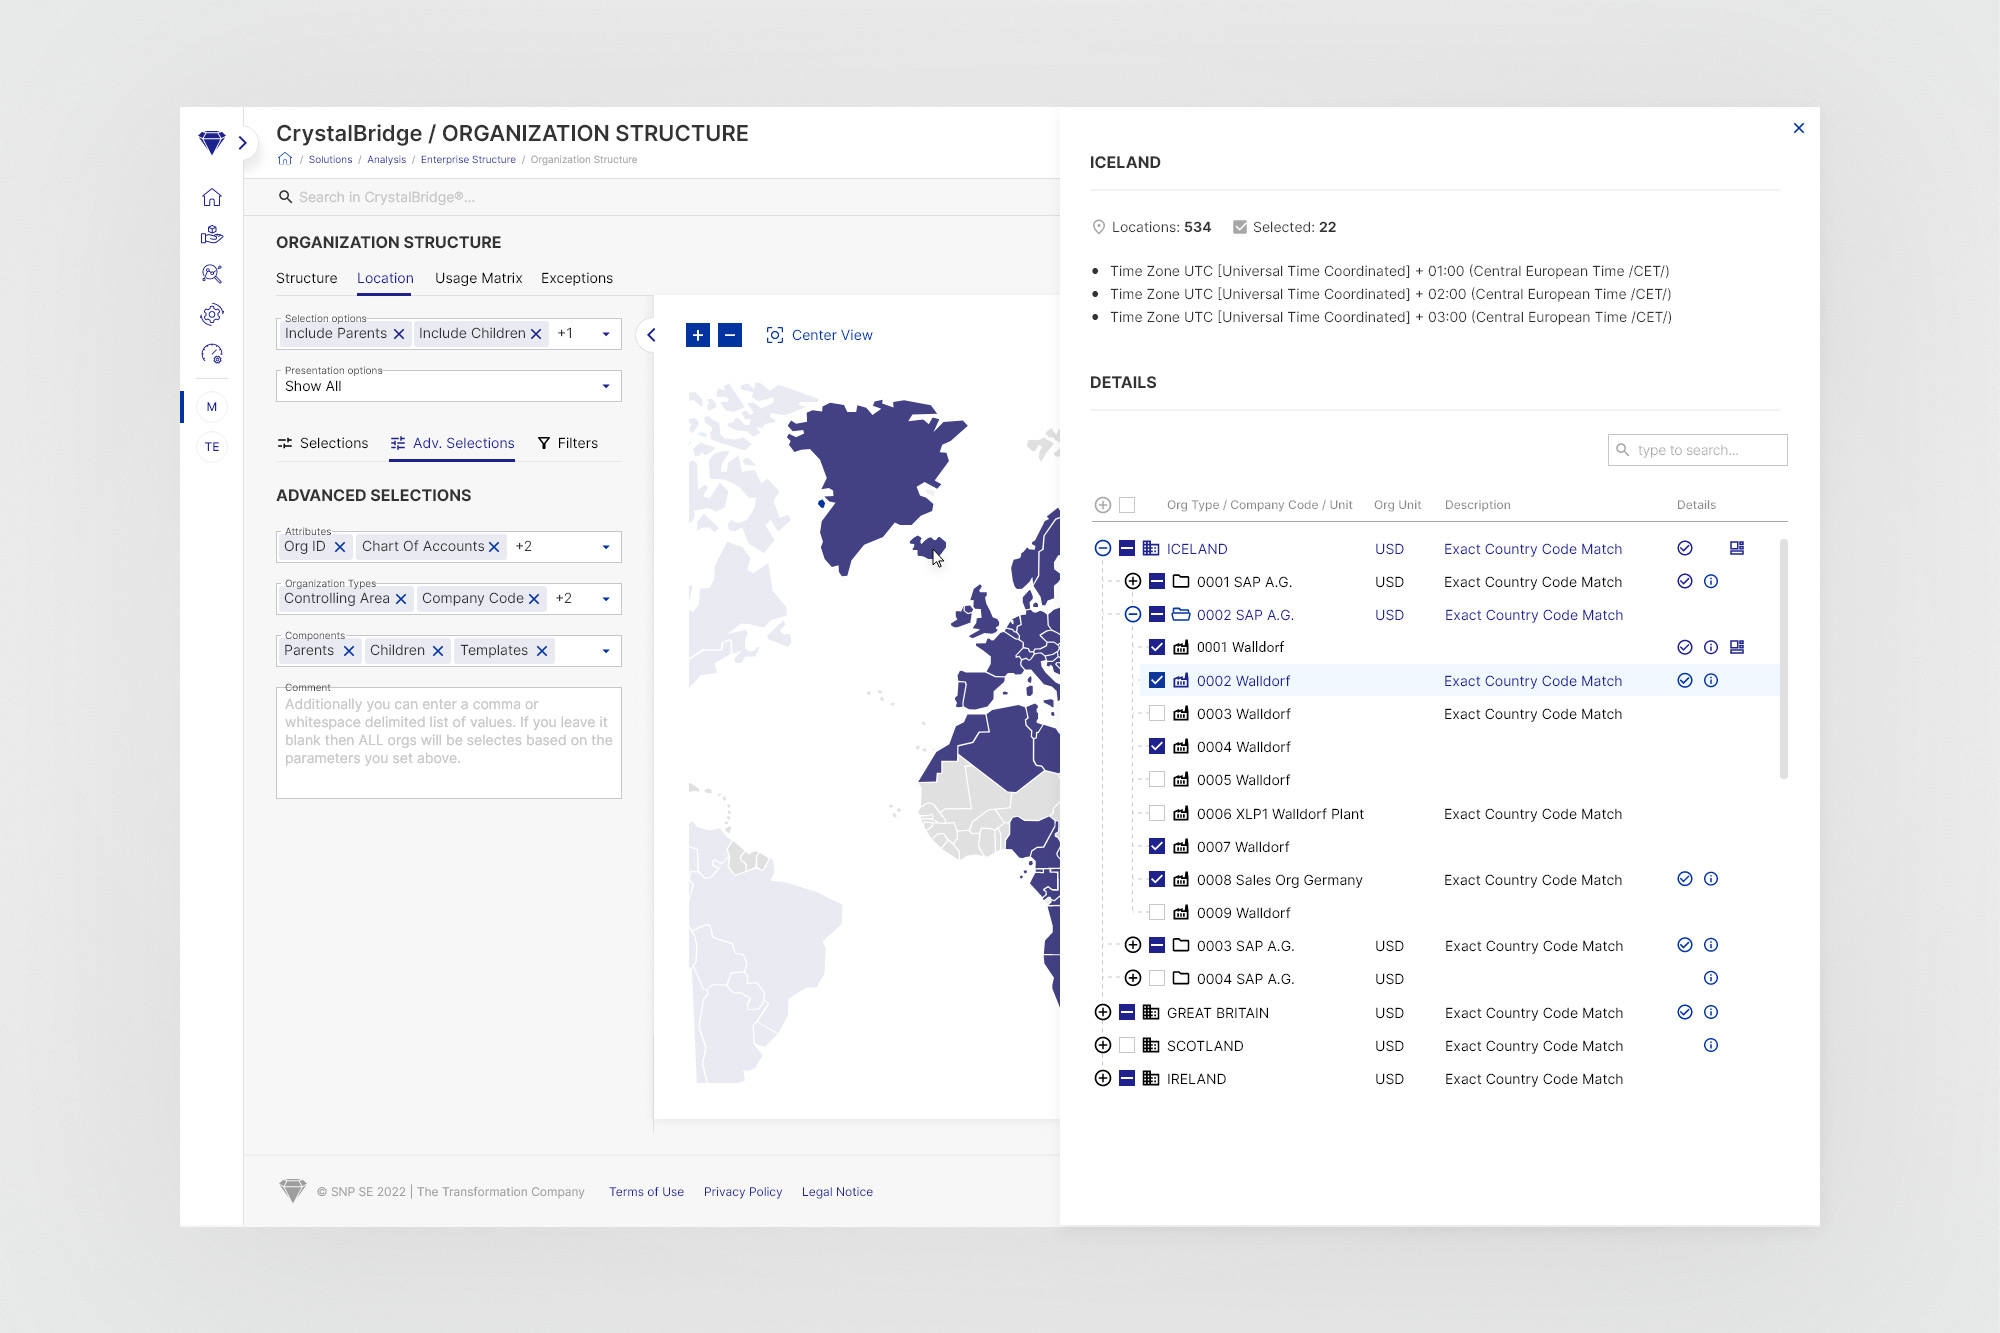
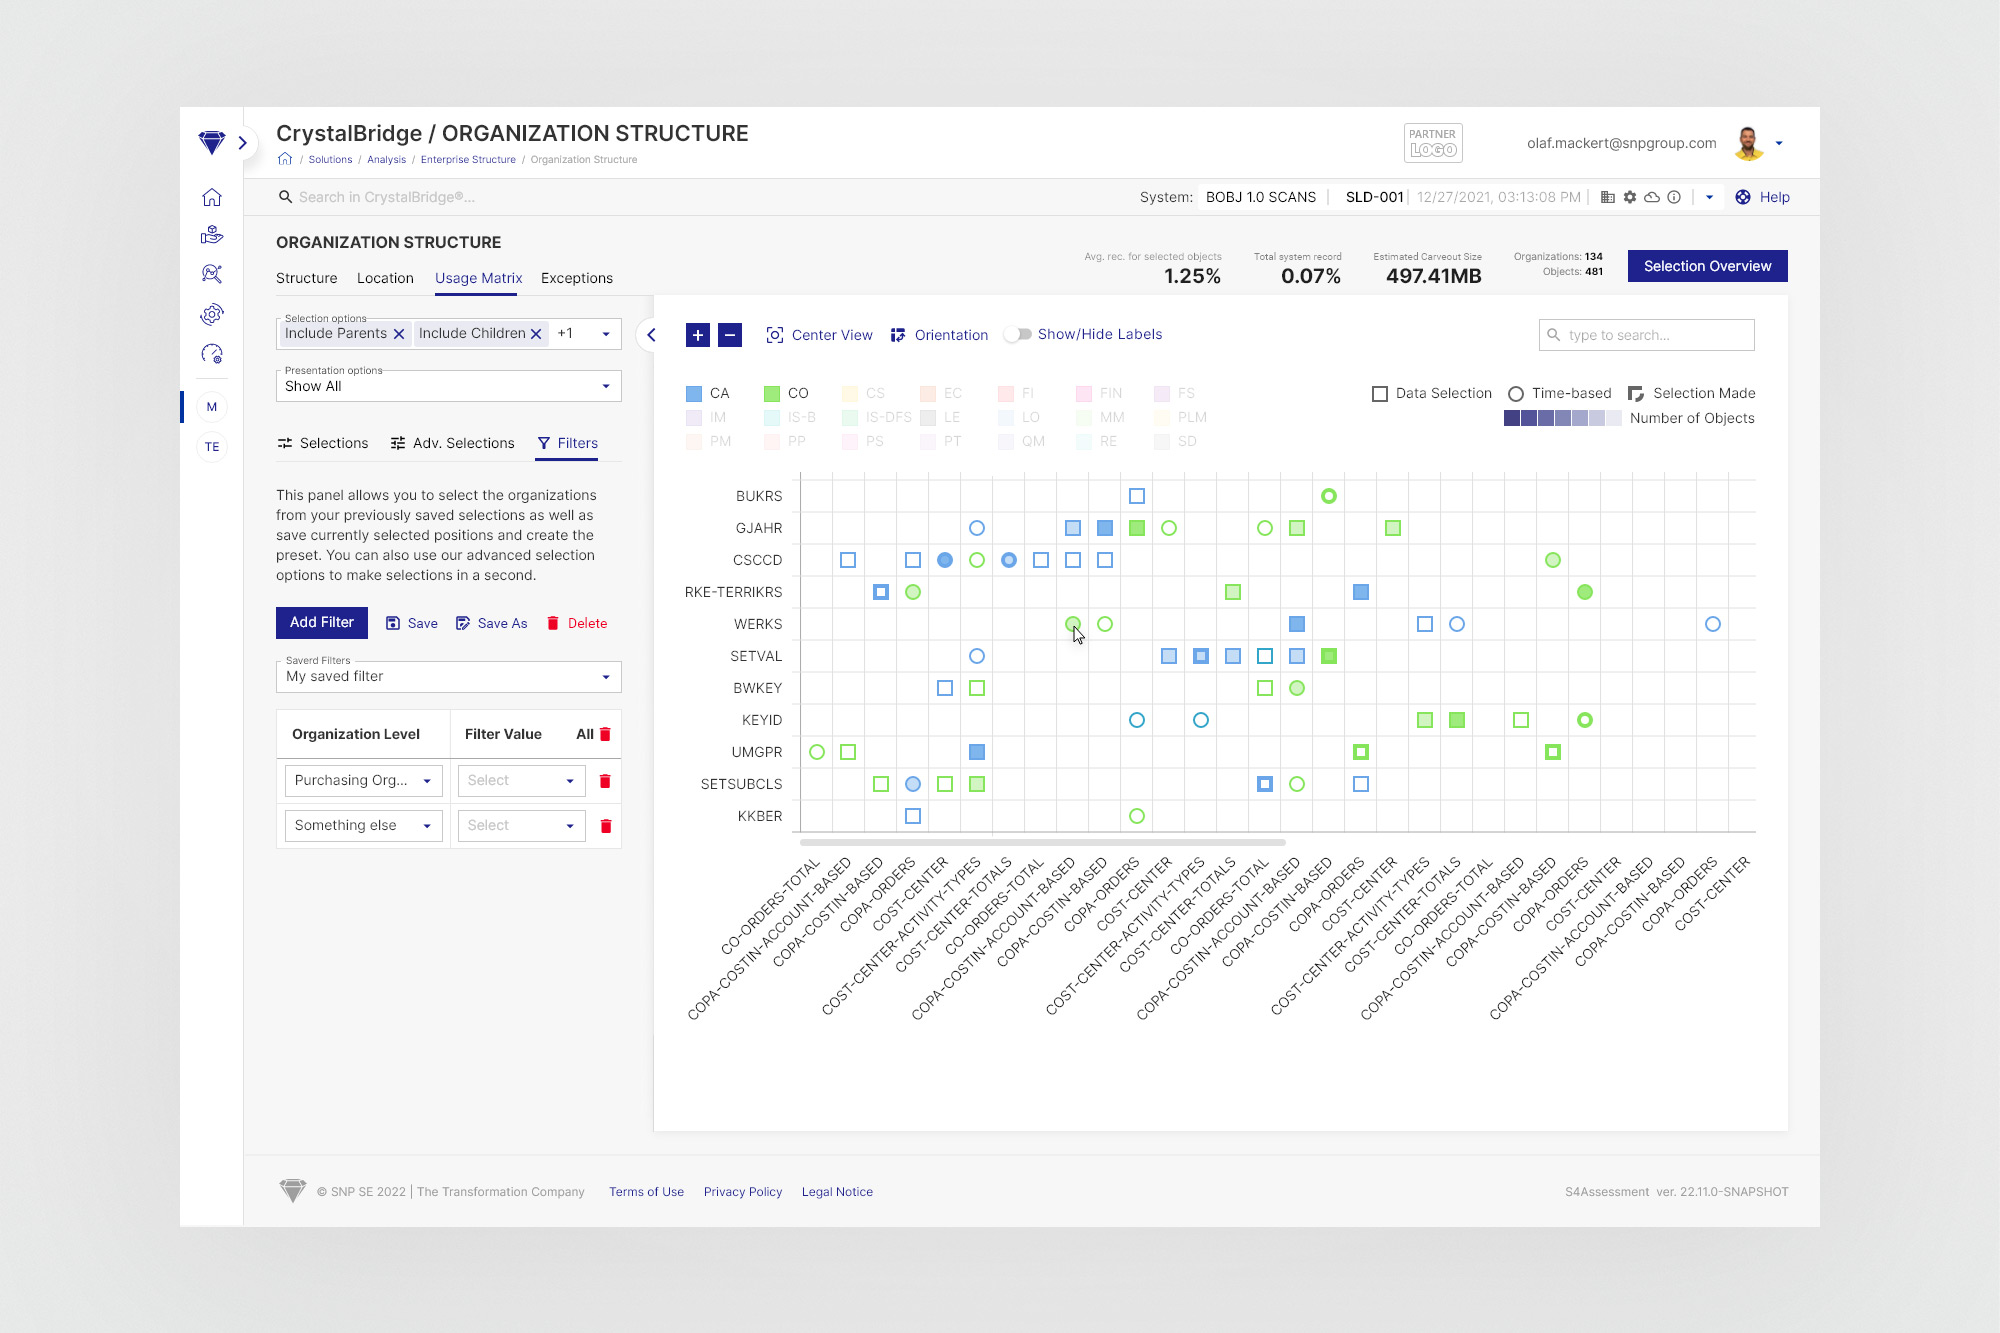
The tool was created on the basis of three independent subpages of the CrystalBridge application, combining the presentation and selection options available on the mentioned pages with a common key. The hiddenable left panel aggregates all the necessary tools for changing presentation parameters and selecting objects visible on the right. At the same time, filters also affect the elements contained in the tree component, as they are a representation of what is in the chart. All this is enclosed in a compact, reusable and scalable view that takes up the entire screen without the need to scroll.